HUMA/USDT Consolidation Nears End: Can the Price Reclaim $0.04?

2025-07-31 06:47:28
Beginner
Quick Reads
As July draws to a close, HUMA/USDT has traded in a narrow range between $0.032 and $0.035 for several consecutive weeks. This article provides an analysis of the pair’s current price action, contract data, and prospective market trends, enabling investors to spot potential opportunities.

HUMA/USDT Latest Price Trend Review


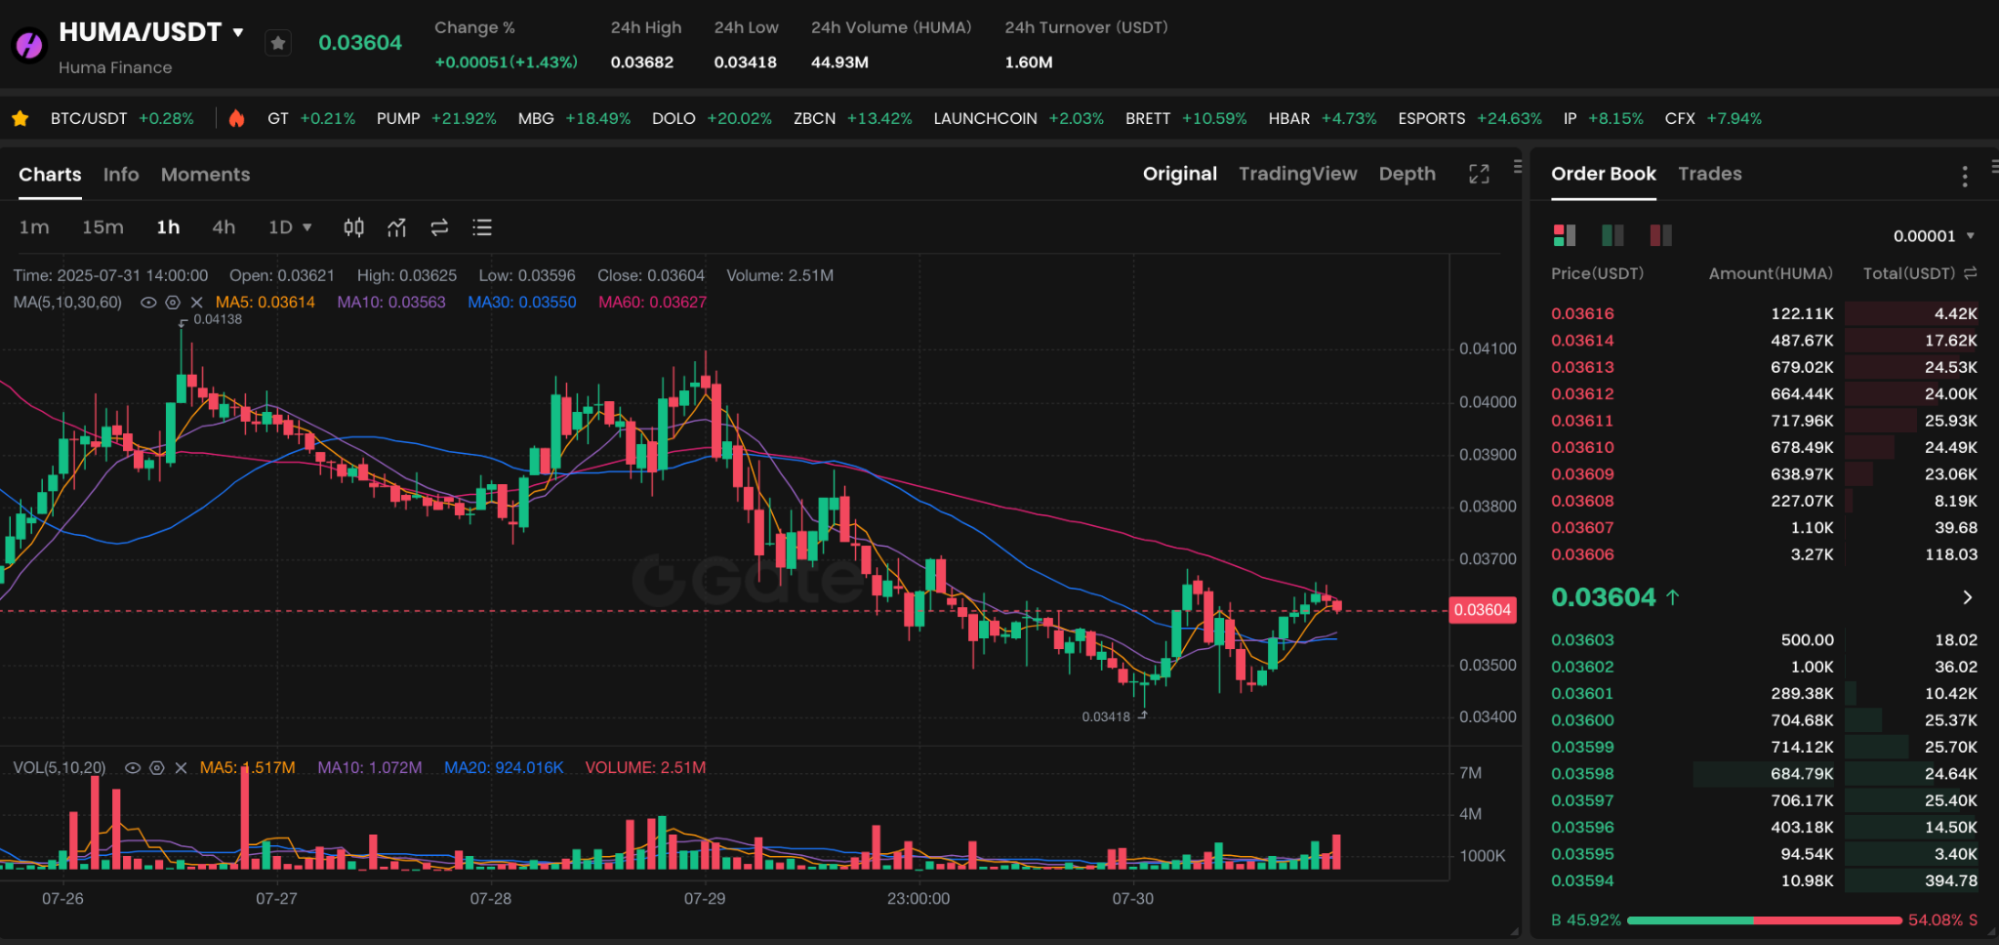
Chart: https://www.gate.com/trade/HUMA_USDT

Since July, HUMA/USDT has shown a clear pattern of volatile consolidation. The current price is $0.03241, representing a 4.31% decline from the previous day. On both the daily and 1-hour charts, the trading range has mostly been between $0.03219 and $0.03481. No definitive market trend has emerged so far.

Regarding moving averages, the MA5 and MA30 are currently intertwined, and the price is below the short-term averages, indicating a weak short-term market structure. Both the MACD and RSI indicators also reflect neutral to slightly bearish sentiment, with most investors remaining in a wait-and-see stance.

Contract Data Reveals Shifting Market Sentiment

Gate platform data shows that the current open interest for HUMA perpetual contracts is 12.52 million tokens, with a 24-hour trading volume of approximately $730,000. This suggests that, despite low prices, trading activity remains robust.

Notably, the current funding rate of -0.0089% indicates that short sellers are paying interest to maintain their positions. This could suggest an increase in short-term bearish sentiment. However, given that the negative funding rate is limited, it does not yet provide a basis for predicting a dramatic sentiment reversal.

PayFi Model and Fundamental Progress

As a key PayFi protocol in the Solana ecosystem, the HUMA project is focused on unlocking the liquidity of real-world income streams via on-chain solutions. By integrating with payment systems like Superfluid, Stripe, and Circle, HUMA is able to convert “future income” into collateral, opening new financing channels for freelancers and creators.

Recently, HUMA has not announced any significant positive developments or protocol upgrades, which may explain the current lack of bullish momentum. Nevertheless, its strong real-world application base continues to offer long-term support for the project.

Technical Analysis: Support and Resistance Levels

The key support for HUMA/USDT now stands at $0.0320. If this level is breached, the price may test the previous low around $0.029. On the upside, primary resistance levels are at $0.0348 and $0.036. A breakout above these could restart a rebound rally.

In terms of trading volume, the average daily trading volume is currently around 200,000 tokens, signaling persistent market sluggishness. If bullish volume surges, it could indicate a trend reversal.

Investment Recommendation: Watch for Opportunities to Buy on Dips

For medium- and short-term investors, the current trading range in HUMA/USDT presents relatively clear opportunities to buy on dips. If the price pulls back and holds below $0.032, investors might consider opening a small position. The target range could be $0.035–$0.038.

Long-term investors should continue to monitor ecosystem expansion, progress in integrating off-chain payment systems, and the token release schedule.

Summary

Following its rapid rise in mid-June, HUMA/USDT has entered a consolidation phase with a gradually narrowing trading range. While overall market enthusiasm has waned, both contract data and project fundamentals indicate that HUMA still has upward potential. Exercising patience and waiting for a technical breakout could present new buying opportunities.

Author: Max
Disclaimer
* The information is not intended to be and does not constitute financial advice or any other recommendation of any sort offered or endorsed by Gate.
* This article may not be reproduced, transmitted or copied without referencing Gate. Contravention is an infringement of Copyright Act and may be subject to legal action.

Share

Crypto Calendar
Tokenların Kilidini Aç
Wormhole, 3 Nisan'da 1.280.000.000 W token açacak ve bu, mevcut dolaşımdaki arzın yaklaşık %28,39'unu oluşturacak.
W
-7.32%
2026-04-02
Tokenların Kilidini Aç
Pyth Network, 19 May'da 2.130.000.000 PYTH tokenini serbest bırakacak ve bu, mevcut dolaşım arzının yaklaşık %36,96'sını oluşturacak.
PYTH
2.25%
2026-05-18
Tokenların Kilidini Aç
Pump.fun, 12 Temmuz'da 82,500,000,000 PUMP token'ı kilidini açacak ve bu, mevcut dolaşımdaki arzın yaklaşık %23,31'ini oluşturacak.
PUMP
-3.37%
2026-07-11
Token Kilidi Açma
Succinct, 5 Ağustos'ta mevcut dolaşımdaki arzın yaklaşık %104,17'sini oluşturan 208,330,000 PROVE token'ını serbest bırakacak.
PROVE
2026-08-04
sign up guide logosign up guide logo
sign up guide content imgsign up guide content img
Sign Up

Related Articles

What is Fartcoin? All You Need to Know About FARTCOIN
Intermediate

What is Fartcoin? All You Need to Know About FARTCOIN

Fartcoin (FARTCOIN) is a representative meme coin within the Solana ecosystem based on an AI-driven narrative. Its core concept originated from an experiment aimed at exploring the "boundaries between AI Agents and humor." More than just a digital asset with social attributes, the project deeply couples absurd humor culture with on-chain financial logic by integrating autonomous AI interaction models.
2026-03-04 05:38:51
Gold Price Forecast for the Next Five Years: 2026–2030 Trend Outlook and Investment Implications, Could It Reach $6,000?
Beginner

Gold Price Forecast for the Next Five Years: 2026–2030 Trend Outlook and Investment Implications, Could It Reach $6,000?

Analyze current gold price trends alongside authoritative five-year forecasts, integrating an evaluation of market risks and opportunities. This gives investors insight into the potential trajectory of gold prices and the main drivers expected to shape the market over the next five years.
2026-01-26 03:33:33
2026 Silver Price Forecast: Bull Market Continuation or High-Level Pullback? In-Depth Analysis of Silver Candlestick Chart
Beginner

2026 Silver Price Forecast: Bull Market Continuation or High-Level Pullback? In-Depth Analysis of Silver Candlestick Chart

2026 Silver Price Forecast: Latest Outlook This article integrates current market trends, silver candlestick chart analysis, and momentum factors to assess the potential key support and resistance levels, upside targets, and pullback risks for silver prices. The goal is to help investors make informed, rational decisions.
2026-01-28 08:36:39
Crypto Future Profit Calculator: How to Calculate Your Potential Gains
Beginner

Crypto Future Profit Calculator: How to Calculate Your Potential Gains

Crypto Future Profit Calculator helps traders estimate potential earnings from futures contracts by considering entry price, leverage, fees, and market movement.
2025-02-09 17:28:28
Crypto Futures Calculator: Easily Estimate Your Profits & Risks
Beginner

Crypto Futures Calculator: Easily Estimate Your Profits & Risks

Use a crypto futures calculator to estimate profits, risks, and liquidation prices. Optimize your trading strategy with accurate calculations.
2025-02-11 02:25:44
What is Oasis Network (ROSE)?
Beginner

What is Oasis Network (ROSE)?

The Oasis Network is driving the development of Web3 and AI through smart privacy technology. With its privacy protection, high scalability, and cross-chain interoperability, the Oasis Network is providing new possibilities for the future development of decentralized applications.
2025-05-20 09:41:15