Since the outbreak of the US-Iran war, crude oil and gold—both closely tied to geopolitical events—have taken sharply different paths: oil has surged, while gold has edged lower. What explains this divergence?
Gold, as a natural currency, fulfills three primary hedging roles: guarding against geopolitical risk, inflation risk, and US dollar risk. These three forces collectively shape gold prices, with their influence waxing and waning at different times.
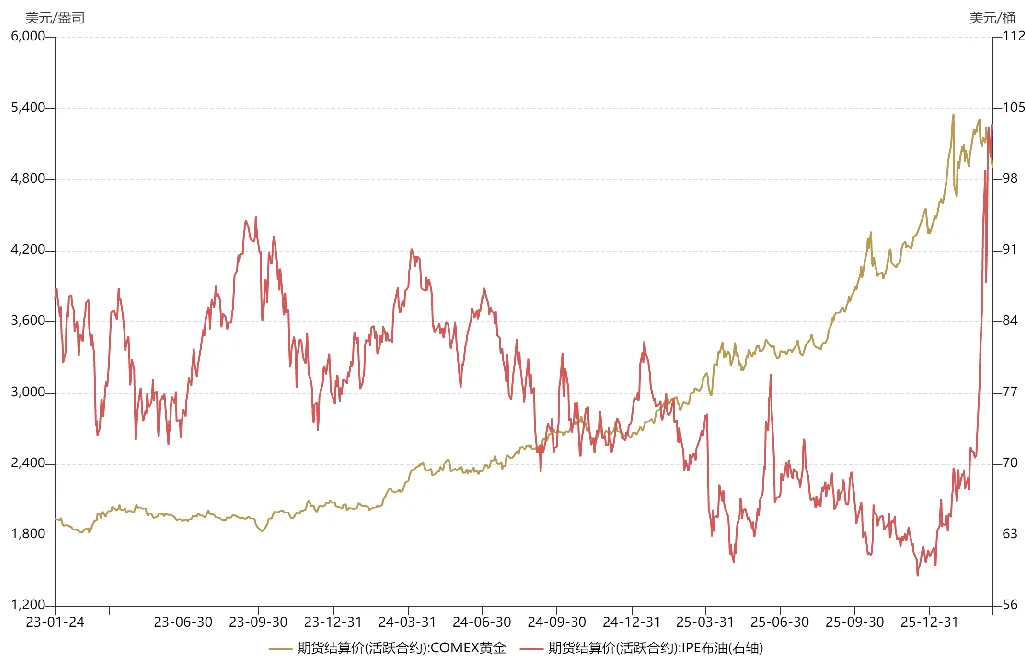
Since late 2023, precious metals have entered a super bull market, with gold soaring from $1,800 to over $5,000. This extraordinary rally stems from gold simultaneously serving as a hedge against geopolitical turmoil, inflation, and dollar risk.
In October 2023, on the heels of the Russia-Ukraine war, large-scale conflict erupted between Israel and Palestine, plunging the Middle East into chaos. The Red Sea crisis broke out in 2024, with the Bab el-Mandeb Strait blocked. In 2025, Trump assumed office, further destabilizing the international order. These events underscore escalating geopolitical risk, providing strong support for gold prices.
Meanwhile, in 2023, the US economy shifted from overheating to stagflation. By 2024, political factors prompted the Federal Reserve to begin an aggressive rate-cutting cycle before inflation was contained, unleashing a flood of dollar liquidity. This combination of mid-term monetary easing and renewed inflation risk meant gold simultaneously acted as a hedge against both dollar and inflation risk, fueling its rally.
With all three hedging functions engaged, gold prices soared. The Fed’s easing cycle also benefited both emerging and developed markets, triggering bull runs in A-shares and US stocks alike.
Turning to oil, last year’s average price was clearly lower than the year prior. This was because, after Trump took office, he persuaded OPEC to ramp up production in an effort to force Russia to concede at the negotiating table. This strategy briefly worked, with Putin showing flexibility on peace talks. Without the US-Iran war, a Russia-Ukraine ceasefire agreement likely would have been signed in the first half of this year.
Since the Middle East war began, gold and oil prices have both fluctuated repeatedly, but their trends have diverged due to different underlying drivers.
For gold, from mid- to late January (about two weeks before the war), as the probability of US-Iran conflict kept rising, gold prices climbed, reflecting its geopolitical hedging role. At the time, mainstream market expectations were for a brief conflict, similar to last year’s “Midnight Hammer” operation.
After the US carried out a “decapitation” strike against Iran, gold rebounded briefly but then plummeted. This was due to capital rotating from gold into oil; with gold positions heavily concentrated, investors sold gold to raise liquidity and go long oil. In effect, this portfolio rotation caused gold to fall and oil to rise.
Meanwhile, as overseas markets began to price in a protracted US-Iran war, risk assets like US equities came under pressure, triggering a wave of redemptions. The US financial market faced a liquidity crunch, and gold—second only to cash in liquidity—was sold off heavily. In early March, the sharp sell-off in gold was not due to bearish sentiment, but rather a defensive response to the liquidity crisis.
If it were simply a liquidity crunch, gold prices would typically form a “deep V” recovery, creating buying opportunities. But more trouble followed. Since mid-March, overseas expectations for the US-Iran conflict have grown more pessimistic. Markets now fear not only a prolonged blockade of the strait, but also large-scale attacks on energy infrastructure, which could keep oil prices elevated, inflict severe damage on the global economy, and even destabilize the international order. In this scenario, the Fed might delay rate cuts or even resume rate hikes as it did in 2022. On these expectations, gold suffered a record-breaking correction.
In short, gold’s geopolitical hedging function remains intact, but its recent plunge is driven by expectations of a Fed policy reversal. Gold’s anti-dollar-hedge attribute has overtaken its geopolitical and inflation hedging roles as the primary driver. Unlike earlier declines, the fundamentals have shifted: this is no longer about a liquidity crisis or profit-taking, but about fears of Fed tightening. This anxiety is also reflected in risk assets like A-shares and US stocks—when the nest is overturned, no egg remains intact.
Since the US-Iran war began, oil prices have also seen dramatic swings, driven by overseas investors’ mispricing of geopolitical risk. After the “decapitation” strike, oil surged to nearly $120 per barrel. Yet in early March, after Trump suggested the war would soon end, the market executed “TACO” trades, betting on a de-escalation in Iran and causing oil prices to plunge 30%. However, unlike tariff disputes, Trump does not control the outcome of a geopolitical crisis—he cannot simply walk away if the strait remains blocked. Ultimately, the market revised its oil outlook, and prices returned to an upward trajectory.
Markets sometimes misprice geopolitical risk, but these errors are not always negative—oil price declines can create buying opportunities for new entrants.
Looking ahead, the future paths of gold and oil depend on how the US-Iran conflict unfolds. If it turns into a prolonged war like Russia-Ukraine, gold may lack allocation value in the first half of the year, and the energy sector may offer better short-term opportunities. However, a reversal is still possible. The US-Iran war could reach a critical turning point, determining whether the Strait of Hormuz can be reopened soon—much will depend on Trump’s decisions.
Disclaimer:
-
This article is republished from [Yang Kai Macro]. Copyright belongs to the original author [Yang Kai Macro]. If you have any objections to this republication, please contact the Gate Learn team, and we will respond promptly in accordance with relevant procedures.
-
Disclaimer: The views and opinions expressed in this article are solely those of the author and do not constitute investment advice.
-
Other language versions of this article are translated by the Gate Learn team. Do not copy, distribute, or plagiarize any translated article without mentioning Gate.