Why Is Ethereum Leading the Recent Rally?
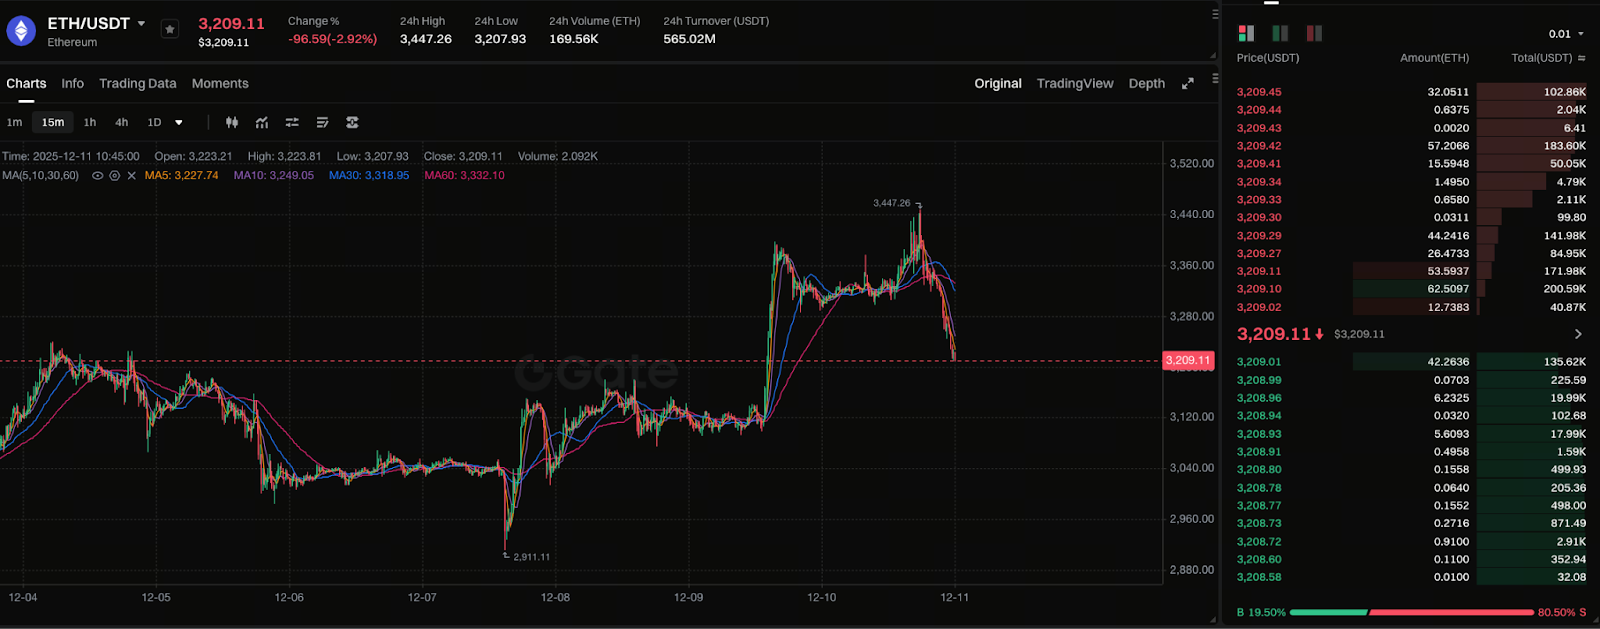
Chart: https://www.gate.com/trade/ETH_USDT
In early December 2025, Ethereum’s performance stood out among major cryptocurrencies, positioning it as the market’s leader. Three primary factors have fueled ETH’s robust rebound: renewed institutional capital inflows, strategic accumulation by whale addresses at lower price levels, and improving macroeconomic expectations.
- Recent market data shows a clear uptick in ETH holdings by institutions and large trading accounts. Some funds have consistently built positions near $3,000, laying a solid foundation for buy-side support. As sentiment shifts from previous caution to renewed optimism, more investors are reassessing ETH’s valuation advantages.
- On-chain analytics reveal that long-term holders—commonly known as whales—have been accumulating at lower prices, with active address counts rising. This pattern typically signals a potential trend reversal and provides ETH with essential support at its base.
- Macroeconomic conditions have also played a pivotal role. Growing expectations for a shift in monetary policy have lifted overall risk asset sentiment, sparking a broad crypto rebound in which Ethereum has been a clear beneficiary. Early positioning for a year-end rally has further reinforced ETH’s upward momentum.
Price Action and Key Support/Resistance Levels
Currently, Ethereum has reclaimed the $3,320–$3,330 range and briefly surpassed the $3,400 resistance level. Multiple institutional analysts have identified this zone as a critical structural area, impacting both short-term market direction and the potential for further upside.
From a technical perspective:
- Key support range: $3,200–$3,250
If ETH maintains above this range, short-term bulls remain in control.
- Short-term resistance levels: $3,320 and $3,350
Repeated failures to break these levels may trigger a pullback.
- Critical breakout level: $3,400
If ETH holds above $3,400, it may attract additional trend-following traders and quantitative capital.
While ETH is currently consolidating above $3,300, a surge in selling pressure or waning momentum at higher levels could prompt a retest of lower supports.
Is ETH Truly “Stable Above $3,300”?
On the surface, Ethereum has repeatedly closed above $3,300 and briefly touched $3,400, signaling stronger buying interest. However, being “above” does not necessarily mean “stable.”
ETH’s current market structure exhibits several characteristics:
- Buying interest has returned, but lacks sustained momentum
Bullish activity is concentrated in specific periods, without clear signs of trend continuation.
- Selling pressure remains present
Some short-term capital has taken profits at higher levels, limiting ETH’s breakout strength.
- Upward momentum is driven primarily by sentiment and short-term rebounds
If macro expectations shift, ETH could still correct quickly.
In summary, the $3,300 level currently acts as a “tentative foothold.” Whether it becomes a true price floor depends on trading volume and capital flows in the coming days.
Has the Year-End Rally Arrived? Balancing Potential and Risk
Opinions on whether the year-end rally has fully materialized remain divided. The consensus is that while there is potential, certainty is elusive.
Potential Drivers:
- Institutional capital is gradually returning to risk assets
Year-end is typically a period for fund reallocation. If ETH continues to hold key levels, it could attract more medium- and long-term capital.
- Macro conditions are favorable for risk assets
If markets continue to anticipate monetary easing, large-cap assets like ETH will directly benefit.
- On-chain activity is rising
Developer activity, DEX trading volumes, and stablecoin pool inflows all show signs of recovery.
Risk Factors:
- Some institutions are beginning to reduce positions or lock in profits
This can create short-term downward pressure.
- Macroeconomic data may disappoint expectations
If upcoming data is weak or policy becomes more cautious, markets will reassess risk.
- Year-end is inherently volatile
Portfolio rebalancing, settlements, and hedging activities increase, making high prices more susceptible to swings.
In short: The year-end rally is worth watching, but not guaranteed. ETH’s continued ascent depends on capital flows and macro policy direction.
How Should Investors Evaluate and Position?
To navigate year-end uncertainty, investors can develop strategies across the following dimensions:
1. Monitor Key Price Action
Watch whether ETH can maintain stability in the $3,300–$3,400 range. A breakout and hold above $3,400 could open further upside; a drop below $3,250 warrants caution for a deeper pullback.
2. Manage Overall Position Sizing
Given crypto’s volatility, avoid going all-in. Use staggered entry strategies and set reasonable stop-losses to mitigate potential drawdowns.
3. Integrate Macro and On-Chain Data
Key examples include:
- Federal Reserve policy, inflation expectations, US Dollar Index fluctuations
- ETH on-chain supply changes, DEX capital flows, whale address activity
Alignment across multiple signals increases the probability of success.
4. Distinguish Clearly Between Long-Term and Short-Term Strategies
- Long-term investors: Focus on Ethereum ecosystem development, Layer-2 growth, staking yields, and network demand.
- Short-term traders: Prioritize swing trading rhythm, key support levels, and capital momentum.


