This comprehensive analysis examines ArtMeta (MART), a blockchain-based platform connecting galleries, artists, and collectors in the NFT ecosystem. Starting from its $0.3 launch price in 2022, MART currently trades at $0.001706 with a $170,600 market cap on Gate. The article evaluates historical price trends, supply-demand dynamics, macroeconomic factors, and geopolitical influences shaping MART's trajectory through 2031. Featured price forecasts range from conservative estimates of $0.00156-$0.0017 in 2026 to optimistic scenarios reaching $0.00449 by 2031. Investors receive actionable long-term holding and active trading strategies, comprehensive risk management frameworks, and secure storage guidance via Gate Web3 Wallet. The analysis addresses market volatility, regulatory challenges, and competitive risks while providing expert recommendations for beginners through institutional investors navigating this specialized NFT art platform.
Introduction: MART's Market Position and Investment Value
ArtMeta (MART) serves as a comprehensive platform connecting fine art galleries, artists, and collectors in the emerging NFT marketplace. Since its inception in 2022 with an initial offering price of $0.3, the project has established a unique position bridging traditional art institutions with blockchain technology. As of February 2026, MART maintains a market capitalization of approximately $170,600, with a circulating supply of 100 million tokens and a current trading price hovering around $0.001706. This asset, characterized as a "digital art economy enabler," is playing an increasingly significant role in facilitating art transactions and exhibitions within the metaverse and NFT ecosystems.
This article will comprehensively analyze MART's price trajectory from 2026 through 2031, combining historical patterns, market supply-demand dynamics, ecosystem development, and macroeconomic conditions to provide investors with professional price forecasts and practical investment strategies.
I. MART Price History Review and Market Status
MART Historical Price Evolution Trajectory
- 2022: MART reached a peak price of $0.380768 on July 14, representing its highest valuation since launch, with the token initially priced at $0.3 during its public offering
- 2025: The token experienced significant downward pressure, declining to its lowest recorded level of $0.00129817 on April 7
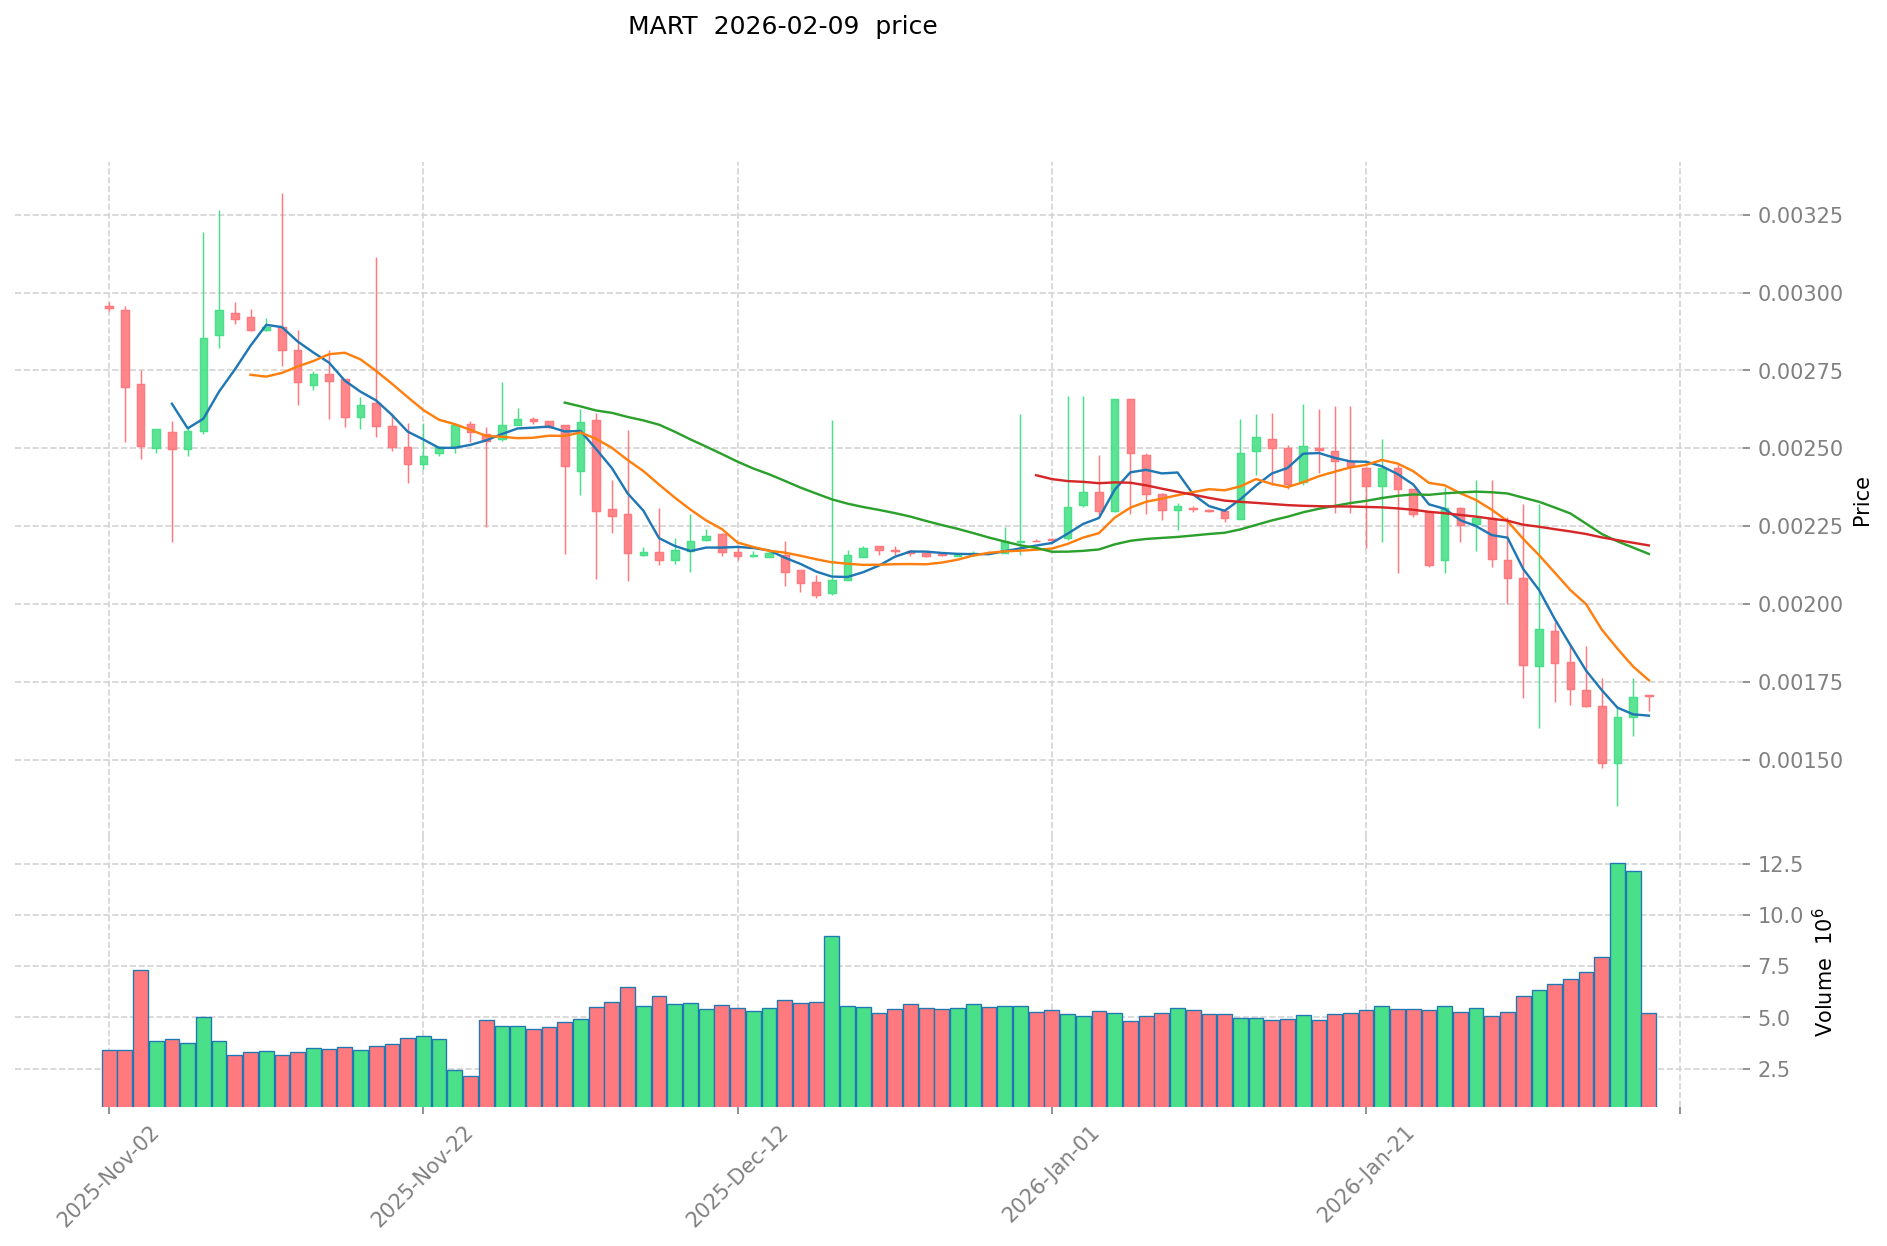
- 2026: As of February 9, MART trades at $0.001706, reflecting a decline of approximately 99.43% from its initial offering price
MART Current Market Status
As of February 9, 2026, MART is priced at $0.001706, with a 24-hour trading volume of $8,891.81. The token has demonstrated mixed short-term price action, showing a 0.65% increase over the past hour while experiencing a slight 0.05% decrease over the 24-hour period.
Over extended timeframes, MART has faced considerable selling pressure. The token has declined 10.87% over the past 7 days and 26.11% over the past 30 days. On an annual basis, MART has decreased 29.03% from its price level one year ago.
The current market capitalization stands at $170,600, with MART maintaining a market dominance of 0.0000068%. The token has a circulating supply of 100 million MART, which represents 100% of its total supply of 100 million tokens. The fully diluted market capitalization matches the current market cap at $170,600, indicating all tokens are already in circulation.
MART currently trades at $0.001706, which is substantially below its all-time high of $0.380768 recorded on July 14, 2022. However, the current price represents a modest premium above its all-time low of $0.00129817 reached on April 7, 2025.
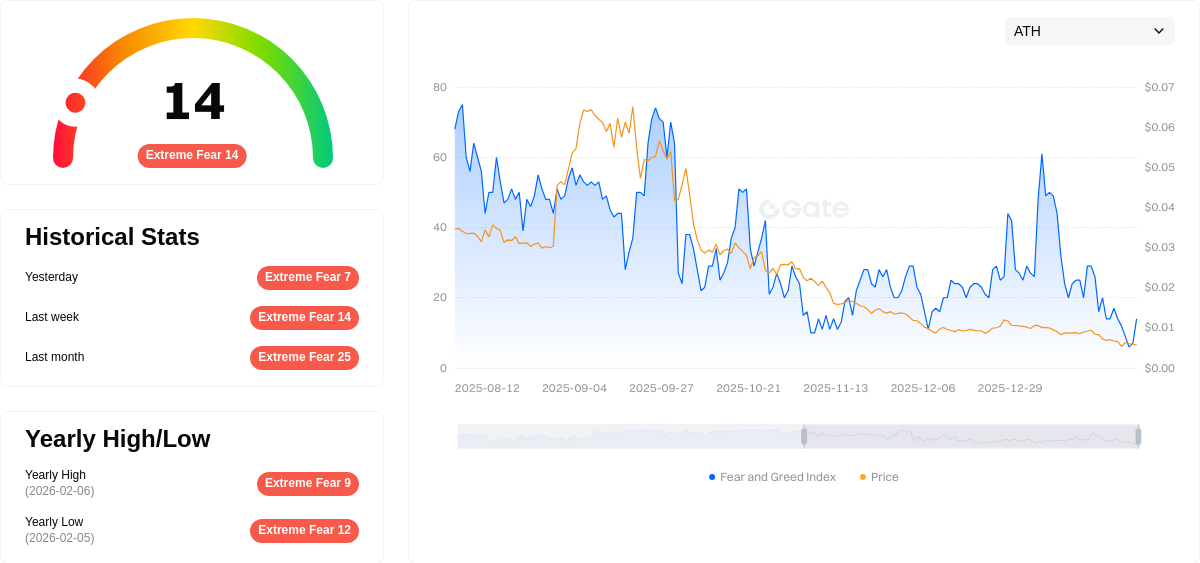
The token is held by approximately 2,484 addresses and is available for trading on Gate.com. According to market sentiment indicators, the current crypto market fear and greed index registers at 14, indicating "Extreme Fear" conditions as of February 9, 2026.
Click to view current MART market price
MART Market Sentiment Indicator
2026-02-09 Fear and Greed Index: 14 (Extreme Fear)
Click to view current Fear & Greed Index
The cryptocurrency market is experiencing extreme fear, with the Fear and Greed Index plummeting to 14. This historically low reading signals significant market pessimism and investor anxiety. During such periods, the market often presents contrarian opportunities for long-term investors. Extreme fear typically precedes market recoveries as panic selling exhausts available sellers. However, exercise caution and conduct thorough research before making investment decisions. Monitor market developments closely and consider your risk tolerance when navigating this volatile environment.
MART Holding Distribution
The holding distribution chart illustrates the concentration of MART tokens across different wallet addresses, providing insights into the token's decentralization level and potential market dynamics. This metric is crucial for assessing whether a small number of addresses control a disproportionate share of the total supply, which could influence price stability and market manipulation risks.
Based on the current data, MART exhibits a moderately concentrated holding structure. The top five addresses collectively control approximately 66.12% of the total supply, with the largest holder possessing 20.00% (20,000K tokens). The remaining 33.88% is distributed among other addresses, suggesting a relatively limited degree of decentralization. This concentration level indicates that a handful of major holders—potentially early investors, team members, or strategic partners—maintain significant influence over the token's market dynamics.
Such distribution patterns carry notable implications for market behavior. The substantial holdings among top addresses create potential for heightened price volatility, particularly if these large holders decide to liquidate portions of their positions. Additionally, coordinated movements by these major stakeholders could significantly impact market sentiment and liquidity. However, the presence of a 33.88% distribution among smaller holders provides some buffer against complete centralization, suggesting a developing ecosystem with growing community participation. From a structural perspective, this distribution reflects a token in its growth phase, where initial allocation remains prominent but gradual diversification is occurring as the project matures.
Click to view current MART Holding Distribution
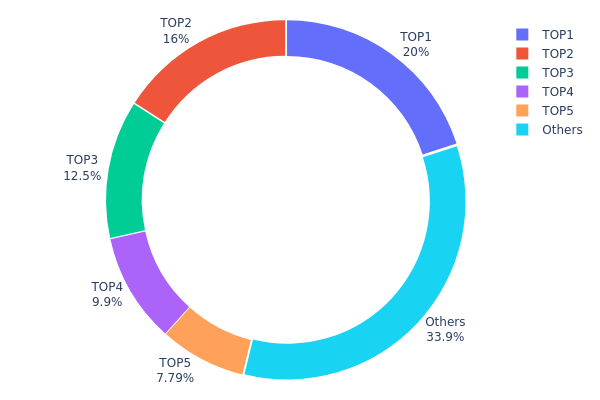
| Top |
Address |
Holding Qty |
Holding (%) |
| 1 |
0x5e5b...c6a974 |
20000.00K |
20.00% |
| 2 |
0xedf7...3f804b |
15987.50K |
15.98% |
| 3 |
0x9c91...8c50ce |
12454.75K |
12.45% |
| 4 |
0xbe9e...ffb634 |
9900.00K |
9.90% |
| 5 |
0x04bb...d9cfe8 |
7791.63K |
7.79% |
| - |
Others |
33866.11K |
33.88% |
II. Core Factors Influencing MART's Future Price Trends
Supply and Demand Dynamics
-
Supply Chain Complexity: MART's supply chain involves multiple stages including extraction, processing, transportation, and storage. Disruptions in any of these stages can significantly impact supply volumes and consequently affect prices.
-
Historical Patterns: Historical data demonstrates that demand plays a decisive role in commodity price determination, with supply factors being secondary. Global economic growth has shown a close correlation with commodity price indices, particularly with emerging markets and developing economies.
-
Current Impact: The COVID-19 pandemic has created a supply-demand mismatch, with supply-side recovery lagging behind demand-side recovery. This misalignment has resulted in faster price increases compared to previous commodity cycles, with annualized growth rates reaching 76.1% in some periods.
Macroeconomic Environment
-
Monetary Policy Impact: Central bank policies remain crucial price drivers. The unprecedented quantitative easing measures by major economies have released substantial liquidity into markets, strengthening the financial attributes of commodities. The US Federal Reserve's balance sheet expansion and European Central Bank's monetary policies continue to influence price dynamics.
-
US Dollar Influence: Since commodities are primarily priced in US dollars, currency fluctuations have inverse effects on prices. When the dollar weakens relative to other currencies, commodity prices tend to rise, and vice versa. The dollar index's movements significantly impact purchasing costs for holders of other currencies.
-
Inflation Considerations: Global economic recovery patterns affect inflation expectations and commodity demand. Uneven recovery across different economies has extended demand cycles, with developed economies showing stronger recovery than emerging markets (excluding China). The Consumer Price Index (CPI) variations between major economies continue to influence relative price movements.
Geopolitical Factors
-
International Conflicts: Geopolitical tensions can severely disrupt commodity supply chains. International disputes between major producing and consuming nations can trigger supply concerns, leading to price volatility and heightened risk-averse sentiment in markets.
-
Vaccination Progress: The uneven distribution of vaccines globally affects the timeline for achieving herd immunity across different regions. High-income countries have secured a disproportionate share of vaccine supplies, while middle and low-income countries face vaccine shortages. This disparity impacts the pace of global economic recovery and commodity demand patterns.
Technology and Production Developments
-
Production Efficiency: Technological improvements in any stage of the supply chain can enhance production efficiency, reduce costs, and increase supply volumes, potentially leading to price adjustments.
-
Capital Investment Trends: Mining companies' capital expenditure patterns significantly influence medium to long-term supply capacity. Following the decline in capital spending since 2014, short-term supply expansion capabilities remain limited. The uncertainty surrounding the pandemic may constrain aggressive capacity expansion plans.
-
Supply Constraints: Pandemic-related restrictions continue to affect production and transportation. Resource-rich countries face slower vaccination rates, potentially delaying capacity recovery. Production capacity restoration is expected to be gradual, with constraints likely persisting throughout the current period.
III. 2026-2031 MART Price Forecast
2026 Outlook
- Conservative Forecast: $0.00156 - $0.0017
- Neutral Forecast: $0.0017 - $0.0020
- Optimistic Forecast: $0.0020 - $0.0024 (contingent on market stabilization and increased adoption)
2027-2029 Mid-term Outlook
- Market Phase Expectation: The token may experience gradual growth during this period, with potential fluctuations reflecting broader market sentiment and project developments.
- Price Range Forecast:
- 2027: $0.00146 - $0.00283
- 2028: $0.00137 - $0.00254
- 2029: $0.00229 - $0.00368
- Key Catalysts: Expansion of use cases, community engagement initiatives, and potential partnerships could serve as primary drivers for price appreciation.
2030-2031 Long-term Outlook
- Baseline Scenario: $0.00247 - $0.00376 (assuming continued project development and market conditions remain favorable)
- Optimistic Scenario: $0.00309 - $0.00449 (with enhanced ecosystem adoption and positive regulatory environment)
- Transformative Scenario: Potentially reaching $0.00449 or higher (under exceptionally favorable conditions including widespread adoption and significant technological advancements)
- 2026-02-09: MART trading within the projected range of $0.00156 - $0.0024 (reflecting current market positioning)
| Year |
Predicted High Price |
Predicted Average Price |
Predicted Low Price |
Price Change |
| 2026 |
0.0024 |
0.0017 |
0.00156 |
0 |
| 2027 |
0.00283 |
0.00205 |
0.00146 |
20 |
| 2028 |
0.00254 |
0.00244 |
0.00137 |
42 |
| 2029 |
0.00368 |
0.00249 |
0.00229 |
45 |
| 2030 |
0.00376 |
0.00309 |
0.00247 |
80 |
| 2031 |
0.00449 |
0.00342 |
0.0026 |
100 |
IV. MART Professional Investment Strategies and Risk Management
MART Investment Methodology
(1) Long-Term Holding Strategy
- Suitable for: Art enthusiasts and NFT market believers who recognize ArtMeta's value proposition in connecting galleries, artists, and collectors
- Operation Recommendations:
- Accumulate during price corrections, particularly when the token trades near support levels
- Monitor platform development milestones and gallery partnerships for long-term value assessment
- Storage Solution: Utilize Gate Web3 Wallet for secure MART storage, ensuring private key protection and regular backup procedures
(2) Active Trading Strategy
- Technical Analysis Tools:
- Moving Averages: Track 50-day and 200-day moving averages to identify trend directions and potential entry/exit points
- Volume Analysis: Monitor 24-hour trading volume (currently around $8,891) to assess market liquidity and trading intensity
- Swing Trading Considerations:
- Set stop-loss orders at 5-10% below entry price to limit downside risk
- Take partial profits during upward momentum while maintaining core position
MART Risk Management Framework
(1) Asset Allocation Principles
- Conservative Investors: 1-2% of crypto portfolio
- Aggressive Investors: 3-5% of crypto portfolio
- Professional Investors: Up to 8% with active monitoring
(2) Risk Hedging Solutions
- Portfolio Diversification: Allocate across multiple NFT and metaverse projects to reduce single-token exposure
- Position Sizing: Implement gradual accumulation strategy rather than lump-sum investment to average entry costs
(3) Secure Storage Solutions
- Hot Wallet Recommendation: Gate Web3 Wallet for convenient trading and platform integration
- Cold Storage Option: Transfer majority holdings to hardware wallets for long-term storage
- Security Precautions: Never share private keys, enable two-factor authentication, verify contract addresses (0xDcfF29b7bd211Aaef6E4a3989e4d3F732cF5b4b6 on Polygon), and beware of phishing attempts
V. MART Potential Risks and Challenges
MART Market Risks
- Price Volatility: MART has experienced significant price fluctuations, with the current price at $0.001706 compared to its launch price of $0.3, representing substantial depreciation
- Limited Liquidity: With 24-hour trading volume around $8,891, the market depth may lead to price slippage during larger transactions
- Market Capitalization: The relatively small market cap of approximately $170,600 indicates limited institutional participation and higher vulnerability to market manipulation
MART Regulatory Risks
- NFT Market Regulation: Evolving regulatory frameworks for NFT platforms may impact ArtMeta's operational model and market accessibility
- Cross-Border Compliance: As an art-focused platform connecting international galleries, regulatory requirements across different jurisdictions may create operational challenges
- Token Classification: Potential regulatory scrutiny regarding MART's token classification and utility within the platform ecosystem
MART Technical Risks
- Smart Contract Vulnerabilities: Deployed on Polygon network, the platform faces inherent smart contract risks including potential coding errors or security exploits
- Platform Adoption: Success depends on continuous onboarding of galleries, artists, and collectors to maintain ecosystem vitality
- Competition: Increasing competition from established NFT marketplaces and emerging art-focused platforms may impact user acquisition and retention
VI. Conclusion and Action Recommendations
MART Investment Value Assessment
ArtMeta represents a specialized platform attempting to bridge traditional fine art with the NFT ecosystem. While the project offers innovative tools for galleries and artists, investors should note the significant price decline from its initial offering and relatively limited current market activity. The long-term value proposition depends heavily on successful adoption by the art community and sustained platform development. Short-term risks include price volatility, limited liquidity, and competitive pressures within the NFT market.
MART Investment Recommendations
✅ Beginners: Start with minimal allocation (less than 1% of crypto portfolio) and focus on understanding the NFT art market dynamics before increasing exposure
✅ Experienced Investors: Consider small speculative positions while monitoring platform development metrics, gallery partnerships, and user growth indicators
✅ Institutional Investors: Conduct thorough due diligence on platform fundamentals, team background, and competitive positioning before any allocation decision
MART Trading Participation Methods
- Spot Trading: Purchase MART tokens through Gate.com's spot market with proper position sizing and risk management
- Dollar-Cost Averaging: Implement systematic accumulation strategy to mitigate timing risk and average entry costs over time
- Platform Engagement: Participate in ArtMeta's ecosystem by exploring NFT exhibitions and artist galleries to better understand the project's value proposition
Cryptocurrency investment carries extremely high risks, and this article does not constitute investment advice. Investors should make prudent decisions based on their own risk tolerance and are advised to consult professional financial advisors. Never invest more than you can afford to lose.
FAQ
What is MART token? What are its main uses and application scenarios?
MART token is a native utility token designed for the Web3 ecosystem, primarily used for transaction fee payments, community governance participation, and platform rewards. Main applications include fee discounts, staking incentives, governance voting on protocol upgrades, and ecosystem incentive distribution.
MART reached its historical peak on February 8, 2026. The token has experienced significant price fluctuations throughout its trading history. Analyzing historical price data reveals dynamic market movements with notable volatility patterns, providing valuable insights for understanding MART's market behavior and performance trajectory.
What are the main factors currently affecting MART price?
MART price is primarily influenced by market demand, trading volume, technological development, regulatory environment, and competitive landscape. Regulatory policy changes and institutional adoption are key drivers of price movements.
To predict MART prices, use technical analysis examining trading volume, price trends, and support/resistance levels. Apply time series models like ETS for seasonal patterns. Utilize Python tools such as statsmodels and scikit-learn for regression analysis and forecasting models.
What are the main risks of investing in MART tokens?
MART token investments carry risks including small market capitalization, low liquidity, high volatility, and regulatory uncertainty. Market sentiment and technological factors can significantly impact token value.
What are the advantages and disadvantages of MART compared to other similar tokens?
MART offers lower transaction fees, faster speeds, and advanced consensus mechanisms for efficiency. Its limited supply reduces inflation risk. However, compared to established tokens, MART has lower market liquidity and less developer ecosystem maturity.
What is the liquidity of MART? On which exchanges can it be traded?
MART maintains strong liquidity with substantial daily trading volume. It is available for trading on major cryptocurrency exchanges, providing users with easy access and efficient price discovery in the market.
What is the MART project's development roadmap? What are the important plans for the future?
MART's roadmap prioritizes user-centric development with planned feature expansions and platform optimization. Key initiatives include enhanced trading analytics, DeFi integration, and ecosystem growth. The roadmap adapts to market demands and community feedback for sustained innovation.
* The information is not intended to be and does not constitute financial advice or any other recommendation of any sort offered or endorsed by Gate.