Pheonixprincess

vip
Age 1.4 Year
Peak Tier 5
No content yet
#Gate正式推出股票交易
Gate Square "Stock Trading Sharing Challenge" is in full swing
Post content related to US stocks with the hashtag #Gate正式推出股票交易 for a chance to win Nvidia stock rewards.
Event Highlights
- Top 1–3: Each wins $50 worth of Nvidia stock
- Daily Best Trading Analysis (7 winners): Each wins $20 worth of Nvidia stock
- Sunshine Award for 100 people + Newcomer First Post Award for 100 people: Each wins $2 worth of Nvidia stock
Gate stocks support direct trading of stocks and ETFs on major exchanges like NASDAQ and NYSE using USDT, connected to compliant brokers, with real
NVDA4.4%
HighAmbition
#Gate正式推出股票交易
Gate Square "Stock Trading Sharing Challenge" is in full swing
Post content related to US stocks with the hashtag #Gate正式推出股票交易 for a chance to win Nvidia stock rewards.
Event Highlights
- Top 1–3: Each wins $50 worth of Nvidia stock
- Daily Best Trading Analysis (7 winners): Each wins $20 worth of Nvidia stock
- Sunshine Award for 100 people + Newcomer First Post Award for 100 people: Each wins $2 worth of Nvidia stock
Gate stocks support direct trading of stocks and ETFs on major exchanges like NASDAQ and NYSE using USDT, connected to compliant brokers, with real dividends automatically credited.
📅 Event duration: June 1, 16:00 to June 8, 23:59 (UTC+8)
Event details https://www.gate.com/announcements/article/51466
#Gate正式推出股票交易 #Gate美股
repost-content-media
  • Reward
  • 5
  • Repost
  • Share
AngelEye:
LFG 🔥
View More
#IntroducingGateStocks
NVIDIA Corporation Technical Analysis and Trading Strategy
NVIDIA Corporation is currently trading at 215.4 dollars per share as of early June 2026, with the stock demonstrating strong momentum following its recovery from earlier year lows. The company continues to dominate the artificial intelligence chip market, maintaining approximately 88 percent market share in discrete GPUs for high-performance computing applications. The data center segment remains the primary revenue driver, accounting for roughly 78 percent of total sales, with this division generating substant
HighAmbition
#IntroducingGateStocks
NVIDIA Corporation Technical Analysis and Trading Strategy
NVIDIA Corporation is currently trading at 215.4 dollars per share as of early June 2026, with the stock demonstrating strong momentum following its recovery from earlier year lows. The company continues to dominate the artificial intelligence chip market, maintaining approximately 88 percent market share in discrete GPUs for high-performance computing applications. The data center segment remains the primary revenue driver, accounting for roughly 78 percent of total sales, with this division generating substantial cash flows that support both aggressive research and development investments and consistent shareholder returns through dividends and share repurchase programs.
Current Price Action and Key Levels
The stock has successfully reclaimed the 200 dollar psychological level and is now consolidating in the 210 to 220 dollar range. Technical analysis reveals that NVDA has established solid support at approximately 200 dollars, which represents a previous resistance level that has now flipped to support following the breakout. This polarity change provides traders with a clear risk management framework. Additional support zones are identified at 190 dollars and 183 dollars, with the latter serving as a major structural level that attracted significant institutional buying during the April correction.
Immediate resistance is encountered at 220 dollars, which capped the recent rally attempt. A decisive break above this level would target 235 dollars, followed by the psychologically important 250 dollar level. Beyond that, longer-term resistance sits at 275 dollars and 300 dollars. Analyst price targets for NVDA currently range from 180 dollars on the conservative end to 500 dollars from the most bullish analysts, with the consensus average price target sitting around 298 dollars. This wide range reflects ongoing debate about the sustainability of AI infrastructure spending growth rates.
Technical Indicators and Momentum Analysis
The 50-day simple moving average currently sits at approximately 199 dollars, providing dynamic support that has been tested and held during recent pullbacks. The slope of this moving average is turning upward, indicating improving intermediate-term momentum. The 200-day moving average is positioned near 205 dollars, which the stock has recently reclaimed, suggesting the longer-term trend may be shifting back to bullish.
The MACD indicator is currently reading approximately positive 3.8, generating a buy signal as the MACD line remains above the signal line with the histogram showing expansion. This suggests bullish momentum is building. The relative strength index is currently in the neutral to slightly overbought territory around 62, which provides some room for further upside before reaching extreme conditions that might trigger profit-taking.
Volume analysis shows favorable accumulation patterns, with above-average volume on up days compared to down days over the past several weeks. This positive volume divergence supports the bullish price structure and indicates institutional accumulation is ongoing. The on-balance volume indicator has been trending higher, confirming that buying pressure is dominating selling pressure.
Fundamental Catalysts and Market Context
NVIDIA's fundamental outlook remains robust despite some moderation in growth rates from peak levels. The company's Blackwell architecture chips continue to experience strong demand, with supply constraints still limiting full revenue potential. Major cloud providers including Amazon Web Services, Microsoft Azure, and Google Cloud continue to expand their AI infrastructure spending, with NVIDIA chips remaining the preferred choice for training large language models and running inference workloads.
The upcoming earnings report in August will be critical for assessing whether the company can maintain guidance for continued data center growth. Management commentary on the timing of next-generation product launches and competitive positioning will be closely watched. Geopolitical risks around Taiwan remain a concern, though the company has been diversifying manufacturing partnerships to reduce concentration risk.
Trading Strategy and Risk Management
For active traders, the current setup presents several viable strategies depending on risk tolerance. Aggressive traders might consider entering long positions on any pullback toward the 205 to 210 dollar zone, using the 200 dollar level as a stop loss to limit risk to approximately 3 percent. The upside target for this trade would be 235 dollars, offering a risk-reward ratio of approximately 1 to 3. Conservative traders might wait for a confirmed breakout above 220 dollars with strong volume before entering, using the breakout level as support for stop loss placement.
Position sizing should account for NVDA's inherent volatility, which typically exhibits daily price swings of 3 to 5 percent and can experience moves of 10 percent or more around earnings releases. A general guideline would be to size positions at no more than 5 to 7 percent of total portfolio value for aggressive growth investors, with more conservative investors limiting exposure to 3 to 5 percent.
For swing traders, the current setup favors long positions as long as the stock maintains closes above the 200 dollar support level. A break below this level would signal potential trend weakness and warrant position reduction. The stop loss for existing long positions should be trailed higher as the stock advances, with a reasonable trailing stop being the 20-day moving average currently near 205 dollars or a fixed percentage below recent swing lows.
Short-term price targets are established at 220 dollars for the immediate term, 235 dollars for the intermediate term, and 250 dollars for the longer-term swing trade. These targets represent resistance levels where partial profits can be taken while allowing a core position to run with a trailing stop. Traders should be aware that NVDA's beta coefficient relative to the broader technology sector suggests it amplifies market movements by approximately 1.5 times.
Risk Factors and Considerations
Several risk factors warrant monitoring. Valuation remains elevated by historical standards, with the stock trading at a forward price-to-earnings ratio above 30 times. Any disappointment in earnings or guidance could trigger significant downside volatility. Competition from AMD and emerging AI chip designers poses a long-term threat to market share, though NVIDIA's software ecosystem provides significant switching costs. Regulatory scrutiny of large technology companies and potential export restrictions could impact revenue potential.
Conclusion
NVIDIA presents a compelling trading opportunity for investors with appropriate risk tolerance. The technical setup favors long positions with defined risk management parameters, while the fundamental backdrop of continued AI infrastructure spending provides support for growth. Traders should enter positions with clear stop loss levels at 200 dollars, appropriate position sizing, and profit targets at 235 dollars and 250 dollars. The key levels to monitor are support at 200 dollars, 190 dollars, and 183 dollars, with resistance at 220 dollars, 235 dollars, and 250 dollars. As long as the stock maintains its position above the 200 dollar support level and key moving averages, the path of least resistance remains to the upside, targeting the consensus analyst price targets in the 298 dollar range over the next 12 months.@Gate_Square #CreatorCarnival
repost-content-media
  • Reward
  • 7
  • Repost
  • Share
AngelEye:
LFG 🔥
View More
#IntroducingGateStocks
#AppleBullishOutlook
Apple (AAPL) Technical Analysis and Trading Strategy – June 2026
Apple Inc. (AAPL) continues to demonstrate resilience as one of the strongest large-cap technology stocks, currently trading near $195 following the company's latest AI-focused announcements at WWDC 2026. While the broader technology sector remains sensitive to macroeconomic developments, Apple benefits from a diversified revenue base, strong cash generation, and one of the most aggressive shareholder return programs in the market.
Current Market Structure
AAPL has spent the last sever
HighAmbition
#IntroducingGateStocks
#AppleBullishOutlook
Apple (AAPL) Technical Analysis and Trading Strategy – June 2026
Apple Inc. (AAPL) continues to demonstrate resilience as one of the strongest large-cap technology stocks, currently trading near $195 following the company's latest AI-focused announcements at WWDC 2026. While the broader technology sector remains sensitive to macroeconomic developments, Apple benefits from a diversified revenue base, strong cash generation, and one of the most aggressive shareholder return programs in the market.
Current Market Structure
AAPL has spent the last several months consolidating between $185 and $205, creating a clearly defined trading range. The current price near $195 places the stock in the middle of this range, suggesting that traders should remain patient until either support or resistance is tested.
Major Support Levels
Primary Support: $185
Secondary Support: $180
Strong Accumulation Zone: $175
Major Resistance Levels
Immediate Resistance: $200
Breakout Confirmation: $205
Major Swing Target: $220
The repeated defense of the $185 support zone indicates continued institutional demand, while sellers have consistently appeared near the $200-$205 region.
Technical Indicators
The 50-Day Moving Average remains near $192, acting as short-term dynamic support. Meanwhile, the 200-Day Moving Average around $188 has recently been reclaimed, improving the longer-term technical outlook.
Momentum indicators remain neutral:
RSI: 52
MACD: Mild Bullish Crossover
Volume: Declining during consolidation
This combination typically signals a market waiting for a catalyst before making its next major move.
Fundamental Outlook
Apple's Services division remains one of the strongest segments within the technology industry, generating recurring revenue through:
App Store
Apple Music
iCloud
Apple Pay
Apple TV+
Services continue to maintain gross margins above 70%, helping offset slower hardware growth.
The company's AI strategy announced during WWDC 2026 could become a major long-term growth catalyst if developer adoption accelerates across the Apple ecosystem.
Apple also continues to return significant capital to shareholders through dividends and share buybacks, providing additional downside support during market corrections.
Bullish Scenario
If buyers successfully push AAPL above $205 with strong volume confirmation, the next upside targets become:
Target 1: $210
Target 2: $220
Extended Target: $235-$250
A breakout above $205 would signal the end of the current consolidation phase and potentially attract fresh institutional buying.
Bearish Scenario
Failure to hold $185 would shift momentum in favor of sellers.
Potential downside targets:
Target 1: $180
Target 2: $175
Extended Target: $165-$170
A break below $185 would invalidate the current neutral structure and suggest broader market weakness.
Trading Strategy
Conservative Traders
Wait for a confirmed breakout above $205
Entry: $205-$208
Stop Loss: $195
Targets: $220, then $235
Aggressive Traders
Accumulate near $188-$190
Stop Loss: $185
Targets: $200, then $210
Range Traders
Buy: $185-$188
Sell: $200-$205
Maintain strict risk management due to breakout risk.
Risk Management
Apple remains less volatile than many technology peers, making it suitable for medium-risk portfolios.
Recommended allocation:
Conservative Investors: 5%-8%
Active Traders: 8%-10%
Never risk more than 1%-2% of total capital on a single trade setup.
Outlook
Apple remains fundamentally strong and technically stable. As long as $185 support holds, the stock retains the potential to challenge $205, $220, and eventually $250 over the coming months. However, traders should remain disciplined and wait for either a confirmed breakout or a high-probability support entry before committing significant capital.
Key Levels to Watch
🟢 Support: $185 | $180 | $175
🔴 Resistance: $200 | $205 | $220
🎯 Bullish Targets: $210 | $220 | $235-$250
⚠️ Bearish Targets: $180 | $175 | $165-$170
@Gate_Square
#CreatorCarnival
repost-content-media
  • Reward
  • 8
  • Repost
  • Share
AngelEye:
LFG 🔥
View More
#LAB
#LABToken | Can LAB Reach $20, $30, $50, or Even $100?
LAB has become one of the most explosive cryptocurrencies of 2026, transforming from a relatively overlooked trading infrastructure token into one of the market's hottest discussions. After surging from below $1 earlier in its trading history to approximately $14.6, traders are now debating whether the rally is only beginning or whether another major correction is approaching.
The combination of low circulating supply, aggressive derivatives activity, heavy speculation, and strong market momentum has created a unique environment whe
LAB90.46%
HighAmbition
#LAB
#LABToken | Can LAB Reach $20, $30, $50, or Even $100?
LAB has become one of the most explosive cryptocurrencies of 2026, transforming from a relatively overlooked trading infrastructure token into one of the market's hottest discussions. After surging from below $1 earlier in its trading history to approximately $14.6, traders are now debating whether the rally is only beginning or whether another major correction is approaching.
The combination of low circulating supply, aggressive derivatives activity, heavy speculation, and strong market momentum has created a unique environment where both upside potential and downside risk remain exceptionally high.
Current Market Position
LAB is currently trading around $14.6, giving the project a fully diluted valuation approaching $14.6 billion based on its 1 billion token supply.
Key price levels currently being watched by traders:
Immediate Support Zone: $12 – $13
Strong Support Zone: $9 – $11
Major Breakdown Area: $6 – $8
Immediate Resistance: $15 – $18
Breakout Resistance: $20 – $25
Extended Bullish Target: $30 – $40
Extreme Bull Market Target: $50 – $75
Speculative Mania Target: $100+
The next few weeks may determine whether LAB enters a sustained expansion phase or experiences another volatility-driven correction.
Why LAB Keeps Moving Higher
The main reason behind LAB's explosive rise is the imbalance between available supply and market demand.
Only a limited percentage of total tokens are actively circulating. When demand enters such an environment, liquidity becomes constrained and price appreciation accelerates rapidly.
Unlike larger cryptocurrencies where billions of dollars are required to move the market significantly, LAB's lower circulating float allows capital inflows to create disproportionately large price movements.
This is why LAB has repeatedly produced vertical rallies while attracting traders searching for high-volatility opportunities.
The Short Squeeze Effect
One of the most powerful forces supporting LAB has been the derivatives market.
Many traders believed the token became overvalued at:
$3
$5
$8
$10
$12
Each time new short positions entered the market, price continued climbing.
As shorts were liquidated, exchanges automatically purchased tokens to close losing positions.
This forced buying pressure created additional upward momentum.
As long as leveraged shorts remain trapped, LAB can continue experiencing squeeze-driven rallies beyond traditional valuation expectations.
Market Capitalization Scenarios
At current prices around $14.6, many investors are attempting to estimate future upside potential.
Scenario 1: LAB Reaches $20
Price Target: $20
Increase From Current Price: +37%
FDV: Approximately $20 Billion
This target would likely require continued momentum, elevated trading volume, and additional short liquidations.
Scenario 2: LAB Reaches $30
Price Target: $30
Increase From Current Price: +105%
FDV: Approximately $30 Billion
This would place LAB among some of the largest crypto projects in the market and would likely require sustained speculation and continued ecosystem growth.
Scenario 3: LAB Reaches $50
Price Target: $50
Increase From Current Price: +242%
FDV: Approximately $50 Billion
This scenario assumes a strong crypto bull market, continued supply constraints, and significant expansion of the LAB ecosystem.
At $50, LAB would become one of the most valuable trading infrastructure projects in the entire digital asset sector.
Scenario 4: LAB Reaches $75
Price Target: $75
Increase From Current Price: +414%
FDV: Approximately $75 Billion
This would likely require extreme speculative enthusiasm similar to previous crypto market cycles where narratives drove valuations far beyond traditional expectations.
Scenario 5: LAB Reaches $100
Price Target: $100
Increase From Current Price: +585%
FDV: Approximately $100 Billion
This represents the most aggressive bullish scenario currently discussed by highly optimistic traders.
While mathematically possible during a powerful market cycle, achieving a $100 valuation would require extraordinary capital inflows and continued scarcity conditions.
Supply Concentration Risk
Despite the bullish momentum, one of the largest concerns remains token ownership concentration.
Multiple community investigations and blockchain analysts have raised concerns regarding the percentage of supply controlled by large holders.
When a relatively small group controls a substantial portion of circulating liquidity, price movements can become highly unpredictable.
Large deposits to exchanges have historically coincided with periods of elevated volatility.
This remains one of the biggest risks facing LAB investors.
The Upcoming Unlock Problem
One of the most important events approaching in 2026 is the token unlock schedule.
Large amounts of currently restricted supply are expected to gradually enter circulation during upcoming months.
Unlocks create two possible outcomes:
Bullish Outcome
Demand exceeds newly released supply.
New buyers absorb unlocked tokens.
Price remains stable or continues higher.
Bearish Outcome
Additional supply exceeds demand.
Profit-taking accelerates.
Liquidity expands.
Price experiences a sharp correction.
Historically, low-float assets often face their greatest challenge when scarcity begins fading.
Bear Market Price Targets
While many traders focus exclusively on upside potential, downside scenarios should also be considered.
If momentum weakens significantly:
First Correction Target: $12
Strong Pullback Zone: $10
Major Support Area: $8
Extreme Capitulation Level: $5 – $6
Historical Panic Zone: Below $5
Previous low-float rallies have demonstrated that declines of 50% to 70% can occur surprisingly fast once buying pressure slows.
Bull Market Outlook
If Bitcoin remains strong, altcoin liquidity continues expanding, and traders remain focused on high-volatility opportunities, LAB could potentially challenge:
$20
$25
$30
$40
$50
during the later stages of the 2026 bull cycle.
Should speculative enthusiasm reach extreme levels, temporary spikes toward $75–$100 cannot be completely ruled out, especially if short squeezes continue creating forced buying pressure.
Final Outlook
LAB currently represents one of the highest-risk and highest-reward opportunities in the cryptocurrency market.
Bullish traders see:
$20 as the next major milestone
$30 as a realistic expansion target
$50 as a strong bull market objective
$75–$100 as a speculative cycle peak possibility
Bearish traders focus on:
Supply concentration
Token unlocks
Valuation concerns
Historical crash patterns
The reality is that LAB has entered a stage where price can move dramatically in either direction. As long as supply remains constrained and shorts continue getting squeezed, further upside remains possible. However, the same factors supporting the rally today could eventually fuel an equally aggressive correction once momentum begins fading.
For now, LAB remains one of the most volatile and closely watched assets in the entire crypto market, with potential outcomes ranging from a pullback toward $8–$10 to an expansion toward $30–$50+ if current momentum continues.
repost-content-media
  • Reward
  • 8
  • Repost
  • Share
Ultra-ShortEth:
Just charge forward 👊
View More
#Gate正式推出股票交易
STOCKS IS OFFICIALLY HERE: A NEW ERA FOR INVESTING
Gate has officially launched Gate Stocks, bringing traditional financial markets and cryptocurrency together on a single platform. This exciting development allows users to access US stocks and ETFs directly through Gate, creating a smoother and more convenient investment experience.
Instead of managing separate brokerage accounts and crypto exchanges, investors can now explore both markets from one place. This launch represents another major step toward the future of digital finance.
INVEST IN US STOCKS DIRECTLY WITH USDT
One of
MSFT2.89%
NVDA4.4%
TSLA-3.48%
META-3.3%
post-image
post-image
post-image
post-image
post-image
post-image
post-image
post-image
SOLx
SOLxSOLx
MC:$2.49KHolders:2
0.46%
  • Reward
  • 5
  • Repost
  • Share
HighAmbition:
Ape In 🚀
View More
#IntroducingGateStocks
#Gate正式推出股票交易
━━━━━━━━━━━━━━━━━━━━━━
🚀 MY TOP US STOCK PICKS ON GATE STOCKS
━━━━━━━━━━━━━━━━━━━━━━
With Gate officially launching stock trading, investors can now access some of the world's biggest companies directly through the platform. Among all the available options, two stocks stand out the most to me right now: NVIDIA and Apple.
━━━━━━━━━━━━━━━━━━━━━━
🔥 NVIDIA: THE AI SUPERPOWER
━━━━━━━━━━━━━━━━━━━━━━
NVIDIA remains one of the strongest technology companies in the world.
The company is leading the artificial intelligence revolution through advanced AI chips, dat
NVDA4.4%
ABBV-2.3%
post-image
post-image
post-image
post-image
  • Reward
  • 7
  • Repost
  • Share
discovery:
To The Moon 🌕
View More
Plaza Small Classroom 🧑‍🏫
What are the core advantages of Gate stocks? 🤔
1️⃣ Direct investment in USDT into US stocks: one-click trading of NASDAQ, NYSE stocks, and ETFs
2️⃣ One-stop trading: easily complete the entire process of buying, holding, and selling
3️⃣ Dividends credited in real-time: company actions such as dividends, stock splits, and mergers are synchronized instantly
4️⃣ Compliance and security: services provided by licensed US brokers, making trading safer
📱 Update to version 8.21.5 and experience now!
More: https://www.gate.com/announcements/article/51452
#Gate正式推出股票交易
Gate广场_Official
Plaza Small Classroom 🧑‍🏫
What are the core advantages of Gate stocks? 🤔
1️⃣ Direct investment in USDT into US stocks: one-click trading of NASDAQ, NYSE stocks, and ETFs
2️⃣ One-stop trading: easily complete the entire process of buying, holding, and selling
3️⃣ Dividends credited in real-time: company actions such as dividends, stock splits, and mergers are synchronized instantly
4️⃣ Compliance and security: services provided by licensed US brokers, making trading safer
📱 Update to version 8.21.5 and experience now!
More: https://www.gate.com/announcements/article/51452
#Gate正式推出股票交易
repost-content-media
  • Reward
  • 5
  • Repost
  • Share
Vortex_King:
2026 GOGOGO 👊
View More
Gate Square "Stock Trading Sharing Challenge" is in full swing
Post content related to US stocks with the hashtag #Gate正式推出股票交易 for a chance to win Nvidia stock rewards.
Event Highlights
- Top 1–3: Each wins $50 worth of Nvidia stock
- Daily Best Trading Analysis (7 winners): Each wins $20 worth of Nvidia stock
- Sunshine Award for 100 people + Newcomer First Post Award for 100 people: Each wins $2 worth of Nvidia stock
Gate stocks support direct trading of stocks and ETFs on major exchanges like NASDAQ and NYSE using USDT, connected to compliant brokers, with real dividends autom
NVDA4.4%
Gate广场_Official
Gate Square "Stock Trading Sharing Challenge" is in full swing
Post content related to US stocks with the hashtag #Gate正式推出股票交易 for a chance to win Nvidia stock rewards.
Event Highlights
- Top 1–3: Each wins $50 worth of Nvidia stock
- Daily Best Trading Analysis (7 winners): Each wins $20 worth of Nvidia stock
- Sunshine Award for 100 people + Newcomer First Post Award for 100 people: Each wins $2 worth of Nvidia stock
Gate stocks support direct trading of stocks and ETFs on major exchanges like NASDAQ and NYSE using USDT, connected to compliant brokers, with real dividends automatically credited.
📅 Event duration: June 1, 16:00 to June 8, 23:59 (UTC+8)
Event details https://www.gate.com/announcements/article/51466
#Gate正式推出股票交易 #Gate美股
repost-content-media
  • Reward
  • 4
  • Repost
  • Share
Vortex_King:
2026 GOGOGO 👊
View More
#TradFi交易分享挑战
#MMM
3M Company (MMM) is trading near $152 as of late May 2026 with a market capitalization close to $80 billion. The stock has underperformed the broader market this year and remains below both its recent highs and long term expectations. The 52 week range between $139 and $177 shows that volatility remains moderate while investor sentiment continues to recover from previous legal and operational challenges. Trading volume remains healthy and short interest is relatively low which suggests that aggressive bearish positioning is limited. The stock is currently positioned in a t
MMM-1.58%
HighAmbition
#TradFi交易分享挑战
#MMM
3M Company (MMM) is trading near $152 as of late May 2026 with a market capitalization close to $80 billion. The stock has underperformed the broader market this year and remains below both its recent highs and long term expectations. The 52 week range between $139 and $177 shows that volatility remains moderate while investor sentiment continues to recover from previous legal and operational challenges. Trading volume remains healthy and short interest is relatively low which suggests that aggressive bearish positioning is limited. The stock is currently positioned in a transition zone where both bulls and bears have valid arguments.
Key Fundamental Metrics
From a valuation perspective MMM trades at a premium compared with its historical averages. The current P E ratio is significantly above the company’s long term median which suggests investors are already pricing in part of the expected recovery story. Dividend yield remains below historical norms because of price appreciation but the company continues to maintain one of the strongest dividend records in corporate America. Revenue multiples and growth adjusted valuation metrics indicate that the stock is not cheap but also not excessively expensive if earnings growth continues as expected. Investors are effectively paying for stability operational improvement and reduced legal uncertainty.
Earnings and Financial Performance
Recent earnings results have shown encouraging signs. The company delivered a solid earnings beat while margins expanded meaningfully compared with previous periods. Revenue growth remains modest but profitability improvements have become the primary driver of investor optimism
Management has focused heavily on cost control operational efficiency and portfolio simplification following the healthcare business separation. While earnings trends have improved free cash flow remains a concern after a substantial decline during the latest quarter. Future reports will need to demonstrate stronger cash generation to support long term confidence.
Management guidance for 2026 remains relatively constructive with expectations for moderate sales growth and continued earnings expansion. Analysts generally forecast mid single digit to low double digit earnings growth over the next few years. If management successfully delivers on these objectives the current valuation could remain justified despite being above historical averages.
Key Technical Levels and Indicators
Technically MMM presents a mixed picture. The stock is trading above its 50 day moving average which reflects improving short term momentum. However it remains below the 200 day moving average which continues to act as a major resistance zone. This positioning often indicates a market waiting for confirmation before committing to a stronger directional trend.
Momentum indicators remain constructive. RSI is near neutral bullish territory suggesting additional upside remains possible before overbought conditions emerge. Short term moving averages are also supporting the recent recovery. Support levels are concentrated around the $140 to $146 region while major resistance appears near $157 followed by the previous highs around $173 and $177. A breakout above these levels could significantly improve the technical outlook.
Analyst Price Targets and Consensus View
Wall Street remains divided on MMM. Average analyst targets generally fall between the upper $160s and upper $170s implying moderate upside from current levels. More optimistic forecasts extend toward $190 and even $230 while bearish projections remain near $133. This wide range reflects uncertainty regarding economic conditions future industrial demand and the sustainability of margin improvements.
Most analysts currently maintain a neutral to moderately bullish stance. The consensus can best be described as Hold with positive bias. Investors are increasingly focused on execution rather than litigation concerns which marks a major shift from previous years.
Legal and Structural Catalysts
One of the most important developments for MMM has been the resolution of major legal liabilities. The PFAS settlement and combat arms earplug litigation have largely transitioned from uncertain risks into structured payment obligations. This has significantly reduced the legal overhang that weighed on valuation for years.
The completion of the Solventum healthcare spinoff also transformed the company into a more focused industrial enterprise. Management can now concentrate resources on higher priority industrial businesses while investors gain greater transparency into operating performance. These structural changes have strengthened the overall investment case.
Bullish Scenario
The bullish outlook is based on improving profitability legal clarity and operational execution. If margins continue expanding and revenue growth accelerates modestly the stock could revisit the $172 to $177 region over the coming quarters. Continued earnings beats and stronger free cash flow would further strengthen investor confidence.
A more aggressive bullish outcome could push shares toward $190 or even above $200 if industrial demand improves and investors assign a higher valuation multiple to the company. Such a scenario would require sustained earnings growth and successful execution across all major business segments.
Bearish Scenario
The bearish argument centers on valuation concerns economic uncertainty and weak free cash flow trends. Despite operational improvements the stock remains expensive relative to its historical averages. Any earnings disappointment or deterioration in industrial demand could trigger renewed selling pressure.
If economic conditions weaken MMM could retreat toward support levels in the low $140s and potentially revisit the 52 week low near $139. A more severe correction would likely require broader market weakness combined with disappointing financial results. In that case downside toward the low $130s cannot be ruled out.
Trading Strategy Recommendations
For swing traders the current setup favors monitoring a breakout above the 200 day moving average. A successful move through this level could create momentum toward higher resistance zones. Risk should remain controlled with stops below key support levels.
For medium term investors pullbacks into the $143 to $146 area may provide attractive entry opportunities. The upcoming earnings report remains the most important near term catalyst and could determine whether the recovery narrative continues gaining strength.
Long term investors may view MMM as a restructuring and recovery story. The company retains a globally recognized brand diversified operations and a long history of shareholder returns. Patience may be required but continued operational improvement could support attractive total returns over time.
How High Can MMM Go
The most realistic upside target over the next 6 to 12 months falls within the $175 to $190 range assuming management meets earnings expectations and economic conditions remain supportive. This would represent meaningful appreciation from current levels while remaining consistent with analyst forecasts.
A highly bullish environment could eventually support prices above $200 especially if free cash flow improves and margin expansion continues. However investors should recognize that such outcomes require multiple favorable factors to align simultaneously.
The bottom line is that MMM stands at a critical inflection point. Legal risks have largely been quantified operational performance is improving and investor focus has shifted toward earnings execution. While challenges remain particularly regarding valuation and cash flow the company now appears better positioned for recovery than at any point in recent years.
repost-content-media
  • Reward
  • 4
  • Repost
  • Share
MasterChuTheOldDemonMasterChu:
Just charge forward 👊
View More
#GtTokenAnalysis.
GateToken (GT) currently trades at approximately $7.25 with a market capitalization of $777 million. The token reached an all-time high of $25.93 on January 25, 2025, and is currently trading about 73% below that peak. The 24-hour trading volume stands at $3.69 million, showing consistent market activity. The circulating supply is approximately 106.48 million GT out of a total supply of 121.3 million GT, with a maximum supply capped at 300 million GT.
Key Technical Levels
Support levels are positioned at $6.84, $6.76, and $6.72, providing potential entry points for buyers. R
GT-3.59%
HighAmbition
#GtTokenAnalysis.
GateToken (GT) currently trades at approximately $7.25 with a market capitalization of $777 million. The token reached an all-time high of $25.93 on January 25, 2025, and is currently trading about 73% below that peak. The 24-hour trading volume stands at $3.69 million, showing consistent market activity. The circulating supply is approximately 106.48 million GT out of a total supply of 121.3 million GT, with a maximum supply capped at 300 million GT.
Key Technical Levels
Support levels are positioned at $6.84, $6.76, and $6.72, providing potential entry points for buyers. Resistance levels are identified at $6.96, $6.99, $7.07, $8.05, $9.34, $10.43, $11.49, $14.79, and $21.93. The all-time high of $25.96 remains the ultimate resistance level. The 50-day simple moving average sits at $7.13 while the 200-day simple moving average is at $8.39. GT currently trades below both moving averages, indicating bearish momentum. The Relative Strength Index is at 43.52, placing GT in neutral territory. The Fear and Greed Index reading of 18.34 indicates extreme fear in the market.
Price Predictions and Outlook
Analysts predict GT could reach average prices between $7.33 and $9.68 in 2026, with potential highs reaching $12.80. Short-term forecasts suggest GT could test levels between $6.70 and $7.44 in coming weeks. June 2026 projections indicate a potential range between $7.00 and $8.95. If GT establishes stability above $7.50 with reduced volatility, the market could extend upward toward $9.00 to $12.00. Technical analysis shows a bearish bias on weekly and 4-hour charts with a double top pattern observed, suggesting continued selling pressure unless price reclaims levels above $10.43.
Gate.io Token Burn Mechanism
Gate.io has burned 184,819,426 GT cumulatively, representing over $1.901 billion in value destroyed. In Q4 2025 alone, 2,163,900 GT were burned worth over $26.92 million. This burn mechanism has reduced total supply from 300 million tokens by approximately 61.61% to 62.46%. Gate.io commits 15% of business profits from trading to buy back and burn GT, plus an additional 5% for research and development, totaling 20% of profits dedicated to GT value enhancement. The official reserve holds 30 million GT permanently frozen as an insurance fund for burns only. All burn records are publicly verifiable on-chain.
Web3 Ecosystem Expansion
Gate.io is expanding its Web3 ecosystem through Gate Layer where GT serves as the exclusive gas token. Core applications include Gate Perp DEX, Gate Fun, Meme Go, and Gate Swap, creating a comprehensive Web3 application suite. As the exclusive gas token for Gate Layer, GT is deeply integrated into network operations and transaction execution. This ecosystem expansion drives genuine on-chain consumption and utility demand for GT. The synchronization of deflationary burn mechanism with ecosystem expansion creates a positive feedback loop supporting token scarcity and value.
Benefits of Holding GT on Gate.io
GT holders receive up to 50% discounts on transaction fees when paying with GT across spot trading, leverage trading, futures, wealth management, and lending. The VIP tier system offers progressive benefits: VIP Level 1 requires 100 GT, VIP Level 2 requires 500 GT, and VIP Level 3 requires 1,000 GT. Higher VIP levels unlock progressively better trading conditions and exclusive privileges.
GT holders gain early access to new project subscriptions on the Startup platform and can participate in GT-exclusive airdrops and investment opportunities. The Hodler Airdrop program provides ongoing rewards for GT holders with regular distributions of new tokens. GT holders can participate in token mining for new projects launched on the Startup platform, offering opportunities to earn profits once projects are listed.
Staking GT on GateChain provides native yields up to 10%, offering an additional income stream for holders. Dedicated customer service is available for GT holders, providing priority support and faster resolution of issues. Exclusive events and promotions are regularly offered to GT holders, including trading competitions, bonus programs, and special giveaways.
Trader Impact and Market Psychology
The extreme fear reading of 18.34 on the Fear and Greed Index suggests sentiment is overly pessimistic, which historically marks bottoms in cryptocurrency markets. The double top pattern on the 4-hour chart indicates sellers have been in control, but creates clear levels to watch. A breakdown below $6.24 could accelerate selling, while a reclaim of $10.43 would shift momentum bullish. Volume analysis shows the 24-hour volume to market cap ratio at 0.004759, indicating relatively low trading activity that can lead to sharper price movements.
Long-Term Value Drivers
GT's deflationary burn mechanism is programmatic and transparent with verifiable on-chain data showing consistent supply reduction. Integration as the exclusive gas token for Gate Layer creates genuine utility demand that grows with ecosystem adoption. Gate.io's position as a top-three cryptocurrency exchange by market share with over 47 million users provides a stable foundation. The equitable tokenomics structure with no private sales or institutional allocations at launch ensures fair distribution favoring everyday traders.
Conclusion
GateToken presents a compelling opportunity for traders and investors who understand its value drivers. Current price levels near $7.00 represent a significant discount from the all-time high of $25.93. The combination of deflationary burn mechanism, expanding Web3 utility, and comprehensive holder benefits creates multiple pathways for value appreciation. Key support levels at $6.84, $6.76, and $6.72 provide downside targets, while resistance levels at $8.05, $9.34, and $10.43 represent milestones for bullish confirmation. Gate.io's commitment to burning tokens and expanding the Web3 ecosystem demonstrates long-term vision for GT's success.@Gate_Square @Gate广场_Official
repost-content-media
  • Reward
  • 6
  • Repost
  • Share
MasterChuTheOldDemonMasterChu:
DYOR 🤓 🤓
View More
#WTICrudeFallsBelow90Dollars
WTI crude oil trading near $92.40 per barrel marks an important shift in market sentiment and suggests that the recent weakness below the $90 level may have been temporary rather than the beginning of a prolonged bearish trend. The recovery above key support levels demonstrates that buyers remain active and that underlying supply-demand dynamics continue to provide a foundation for higher prices.
Crude oil remains one of the most influential assets in global financial markets because it affects inflation, transportation costs, industrial production, central bank p
HighAmbition
#WTICrudeFallsBelow90Dollars
WTI crude oil trading near $92.40 per barrel marks an important shift in market sentiment and suggests that the recent weakness below the $90 level may have been temporary rather than the beginning of a prolonged bearish trend. The recovery above key support levels demonstrates that buyers remain active and that underlying supply-demand dynamics continue to provide a foundation for higher prices.
Crude oil remains one of the most influential assets in global financial markets because it affects inflation, transportation costs, industrial production, central bank policy, corporate earnings, government budgets, and investor sentiment. Every significant move in oil prices creates ripple effects across stocks, bonds, currencies, commodities, and cryptocurrencies.
The current advance toward the mid-$90 region reflects a market that is balancing resilient global demand against persistent supply constraints. While economic growth in some regions has moderated, energy consumption remains historically strong and inventories are not showing the type of surplus conditions that would justify a sustained collapse in prices.
Why the $90 Level Matters
The $90 level is more than a simple number. It is a major psychological barrier, a key technical zone watched by institutions, and an area where large trading volumes have historically occurred.
When WTI briefly moved below $90, many traders interpreted it as a bearish breakdown. However, the market's ability to reclaim lost ground and climb back above that level suggests that buyers viewed the weakness as an opportunity rather than a warning sign.
False breakdowns often become powerful bullish signals because traders who sold during the decline are forced to buy back positions as prices recover. This process can accelerate upside momentum and create stronger rallies than would otherwise occur.
The successful defense of the broader $88-$90 zone has improved market confidence and shifted attention back toward higher resistance levels.
Global Supply Conditions
One of the primary reasons oil remains supported is the ongoing discipline among major producing nations.
OPEC+ continues to play a critical role in balancing the market. Although production quotas have gradually evolved, the group remains focused on preventing oversupply conditions that could push prices significantly lower.
Saudi Arabia remains the most influential player within the alliance. The kingdom has repeatedly demonstrated its willingness to adjust production when necessary to stabilize prices and protect long-term market conditions.
Meanwhile, geopolitical risks continue to create uncertainty across several energy-producing regions. Any disruption involving shipping routes, export terminals, pipelines, sanctions, or regional conflicts can immediately affect supply expectations and trigger rapid price movements.
While US shale production remains strong, growth rates have slowed compared with previous expansion cycles. Rising costs, shareholder demands for capital discipline, and operational constraints have reduced the aggressive production growth seen in earlier years.
As a result, the market remains relatively balanced rather than excessively supplied.
Demand Remains Stronger Than Expected
Despite concerns regarding global economic growth, energy demand continues to surprise many analysts.
The aviation sector remains one of the strongest contributors to fuel consumption growth. International travel continues expanding, airline capacity is increasing, and jet fuel demand remains elevated.
Emerging economies continue driving incremental consumption. Countries throughout Asia, the Middle East, and parts of Latin America are experiencing ongoing industrialization, urbanization, and infrastructure development, all of which require substantial energy inputs.
China remains the most closely watched demand center. While economic growth has moderated compared with previous years, the country's manufacturing base, transportation network, and industrial sector continue consuming enormous volumes of crude oil.
India has become another major source of demand growth. Rising incomes, expanding transportation networks, and industrial development continue supporting long-term consumption trends.
These factors help explain why oil has remained resilient despite periodic concerns about economic slowing.
Inflation and Central Bank Implications
Oil prices above $90 create important implications for inflation expectations.
Energy costs directly influence transportation, logistics, manufacturing, agriculture, and consumer spending. When oil rises, the cost of moving goods and services throughout the economy generally increases.
Higher crude prices can slow the progress central banks have made in reducing inflation. This is particularly important for the Federal Reserve, which continues monitoring inflation data closely.
If oil remains above $90 and pushes toward $95-$100, policymakers may become more cautious regarding future interest-rate reductions. Higher energy prices can delay disinflation and potentially keep monetary policy tighter for longer.
This relationship creates one of the most important macro themes for investors. Oil strength supports energy producers but may simultaneously reduce expectations for aggressive monetary easing.
Impact on Global Equity Markets
Rising oil prices create both winners and losers.
Energy companies are the most direct beneficiaries. Higher crude prices typically improve revenues, profitability, cash flow generation, and shareholder returns for exploration and production firms.
Integrated oil giants often experience stronger earnings expectations when crude remains above $90 because their upstream operations become significantly more profitable.
Oil service providers, drilling companies, equipment manufacturers, and energy infrastructure businesses also tend to benefit from stronger industry conditions.
However, sectors heavily dependent on fuel face greater pressure.
Airlines, transportation firms, shipping companies, and certain manufacturers may experience margin compression as operating costs increase.
Consumer-facing businesses can also face challenges if higher energy expenses reduce discretionary spending power.
The overall stock market impact depends on whether investors view higher oil prices as a sign of strong economic activity or as a source of inflationary pressure.
Currency Market Reactions
Oil prices have a powerful influence on currency markets.
Energy-exporting nations often benefit from stronger oil prices because higher export revenues improve trade balances and support government finances.
Oil-importing countries may experience the opposite effect as energy costs increase.
The US dollar's reaction depends largely on inflation expectations and Federal Reserve policy. If rising oil prices increase inflation concerns, markets may expect higher interest rates for longer periods, potentially supporting the dollar.
Currency traders closely monitor these relationships because oil often acts as a leading indicator for broader macroeconomic trends.
Bitcoin and Cryptocurrency Implications
The relationship between oil and cryptocurrency is becoming increasingly important as digital assets mature.
Bitcoin is no longer driven solely by crypto-native developments. Institutional participation has transformed it into a macro-sensitive asset that reacts to liquidity conditions, interest-rate expectations, and global risk sentiment.
When oil rises because economic activity remains healthy, risk assets can continue performing well. Strong growth supports corporate earnings, investment activity, and capital flows into speculative markets.
However, excessively high oil prices can create challenges.
If crude approaches $100 or higher, inflation concerns may intensify. This could reduce expectations for monetary easing and temporarily pressure risk assets, including cryptocurrencies.
For Bitcoin, the ideal environment is often moderate economic growth combined with manageable inflation and improving liquidity conditions.
Current market conditions suggest that oil strength is being interpreted primarily as evidence of resilient demand rather than runaway inflation. This distinction is important because it supports a constructive outlook for both equities and crypto.
Bitcoin could continue attracting institutional capital if investors believe economic activity remains strong while financial conditions gradually improve.
Technical Analysis and Key Price Levels
WTI has regained bullish momentum after successfully defending major support zones.
Immediate support now sits between $90 and $91. This area previously acted as resistance and should attract buyers during pullbacks.
Below that, stronger support exists near $88 and then around $85.
On the upside, the first major resistance zone appears near $94-$95. A breakout above this region could trigger accelerated buying activity and open the path toward $98.
The psychological $100 level remains the ultimate bullish target and would likely attract substantial market attention if reached.
Bullish Scenario
Probability: 55%
The bullish case assumes continued demand resilience, disciplined production management, stable economic conditions, and no significant deterioration in global growth.
Under this scenario, WTI advances toward $95, then challenges $98, and potentially reaches $100-$105 over the coming months.
Institutional buyers would likely remain active under this environment, supporting higher prices.
Neutral Scenario
Probability: 25%
Oil consolidates between $90 and $95 while markets evaluate economic data, inventory trends, and central bank policy developments.
This outcome would create range-trading opportunities but delay a decisive directional breakout.
Bearish Scenario
Probability: 20%
The bearish case would require weaker global demand, rising inventories, disappointing Chinese data, or unexpectedly strong supply growth.
In this scenario, WTI could revisit $90 and potentially test $88-$85 support zones.
However, as long as prices remain above key support levels, the broader structure remains constructive.
Professional Trading Strategy
The dominant trend currently favors buyers.
Accumulation becomes attractive during pullbacks toward the $90-$91 region while maintaining disciplined risk management.
A break above $95 would strengthen bullish momentum and could trigger institutional trend-following flows targeting the $100 region.
Conservative traders should focus on confirmation signals, inventory reports, OPEC communications, and macroeconomic releases before increasing exposure.
Risk management remains essential because oil markets can react violently to geopolitical developments, policy announcements, or unexpected supply disruptions.
WTI crude oil trading near $92.40 reflects a market that continues to benefit from resilient global demand, disciplined supply management, and ongoing geopolitical uncertainty. The recovery above $90 has strengthened the bullish narrative and shifted market attention back toward higher resistance zones.
The most likely path currently favors continued consolidation followed by another attempt to challenge the $95-$100 region. Rising oil prices support energy-sector earnings, influence inflation expectations, shape central-bank decisions, and affect sentiment across equities, currencies, and cryptocurrencies.
For traders and investors, the key levels to monitor remain $90 as major support and $95-$100 as the primary upside target zone. As long as crude remains above support, the broader outlook remains constructive, and further gains cannot be ruled out.@Gate_Square @Gate广场_Official
repost-content-media
  • Reward
  • 5
  • Repost
  • Share
MasterChuTheOldDemonMasterChu:
DYOR 🤓 🤓
View More
#WinGoldBarsWithGrowthPoints
The Win Gold Bars with Growth Points program is a loyalty initiative designed to reward active users on the platform. Growth Points serve as a currency that accumulates based on your trading activity, participation in events, and engagement with platform features. These points can then be redeemed for various rewards, with gold bars being among the most prestigious prizes available.
What Are Growth Points
Growth Points are earned through multiple channels on the platform. Every trade you execute contributes to your Growth Points balance, with higher trading volume
HighAmbition
#WinGoldBarsWithGrowthPoints
The Win Gold Bars with Growth Points program is a loyalty initiative designed to reward active users on the platform. Growth Points serve as a currency that accumulates based on your trading activity, participation in events, and engagement with platform features. These points can then be redeemed for various rewards, with gold bars being among the most prestigious prizes available.
What Are Growth Points
Growth Points are earned through multiple channels on the platform. Every trade you execute contributes to your Growth Points balance, with higher trading volumes generating more points. Spot trading, futures trading, and margin trading all contribute to your point accumulation. Additionally, participating in platform events, completing daily tasks, referring new users, and maintaining active status can significantly boost your Growth Points earnings.
The points system operates on a tiered structure where consistent activity yields compound benefits. Users who maintain regular trading patterns often find themselves earning points at accelerated rates compared to sporadic traders. This incentivizes sustained engagement with the platform ecosystem.
How to Earn Growth Points
Trading activity forms the backbone of Growth Points accumulation. Each completed trade generates points proportional to the trading volume. Spot market trades typically award points based on the notional value of the transaction. Futures and perpetual contracts may offer different point multipliers depending on market conditions and promotional periods.
Daily check-ins represent another reliable source of Growth Points. By logging into your account and accessing the Growth Points section daily, you can claim free points. These daily rewards often increase with consecutive check-ins, encouraging regular platform visits.
Special events and campaigns provide opportunities for bonus point earnings. These may include trading competitions, deposit bonuses, social media engagement tasks, and seasonal promotions. Staying informed about ongoing events through platform announcements ensures you never miss high-yield point-earning opportunities.
Referral programs allow you to earn Growth Points by inviting friends to join the platform. When your referrals complete their first trades or reach certain milestones, both you and your referrals receive point bonuses. This creates a mutually beneficial system for expanding the user community.
VIP status and tier levels can multiply your Growth Points earnings. Higher VIP tiers often come with point multipliers, meaning the same trading activity generates more points compared to lower tiers. Maintaining or upgrading your VIP status should be a strategic priority for maximizing point accumulation.
Accumulating Points for Gold Bars
Gold bars represent a premium redemption option requiring substantial Growth Points. To accumulate sufficient points, you need a systematic approach combining multiple earning strategies. Start by establishing daily routines that include check-ins, reviewing available tasks, and planning your trading activity around high-multiplier periods.
Track your point balance regularly and set milestone targets. Breaking down the total points needed for gold bars into weekly or monthly goals makes the objective more manageable. For example, if a gold bar requires five hundred thousand Growth Points, aim to earn forty thousand to fifty thousand points weekly through consistent activity.
Prioritize high-efficiency point-earning activities. Some tasks or trading pairs may offer better point returns relative to effort or capital invested. Analyze which activities provide optimal point generation for your trading style and risk tolerance. This analysis should include consideration of trading fees, market volatility, and time commitment.
Take advantage of promotional periods when point multipliers are active. During special events, the same trading volume can yield double or triple the normal Growth Points. Planning larger trades or increased activity during these windows accelerates your progress toward gold bar redemption.
Redeeming Growth Points for Gold Bars
Once you have accumulated sufficient Growth Points, navigate to the rewards or marketplace section of the platform. Locate the gold bars listing among available redemption options. Review the current point cost and any terms associated with the redemption, such as shipping arrangements or digital certificate options.
Initiate the redemption process by selecting the gold bar option and confirming your point deduction. The platform will process your request and provide confirmation details. Physical gold bars typically require shipping address verification and may involve delivery timeframes. Digital gold certificates offer immediate fulfillment with blockchain verification of ownership.
Consider the timing of your redemption. Some users prefer to redeem points immediately upon reaching thresholds, while others accumulate points for larger redemptions or wait for promotional discounts on redemption costs. Evaluate your personal preferences and the stability of point values when making redemption decisions.
Maximizing Your Success Rate
Success in winning gold bars requires discipline and strategic planning. Maintain consistent daily activity rather than sporadic intense trading sessions. This approach generates steady point accumulation while managing risk exposure. Set calendar reminders for daily check-ins and event deadlines to ensure no opportunities are missed.
Diversify your point-earning activities across multiple channels. Relying solely on trading exposes you to market volatility risks. Combining trading with referrals, social tasks, and event participation creates more stable point income streams.
Engage with the community to learn about hidden opportunities or tips from successful participants. Forum discussions, social media groups, and platform announcements often reveal strategies for optimizing point earnings or upcoming promotional events.
Monitor your progress through available dashboards and analytics tools. Understanding your earning patterns helps identify which activities provide best returns and where adjustments might improve efficiency. Regular review sessions enable data-driven decisions about time and capital allocation.
Important Considerations
Growth Points programs typically include terms and conditions that users must understand. Points may have expiration dates, requiring redemption within specified timeframes. Trading requirements or minimum balances might apply for maintaining point-earning eligibility. Review these conditions regularly as they can change with platform policy updates.
Tax implications vary by jurisdiction and should be considered when redeeming valuable prizes like gold bars. Consult appropriate financial or legal advisors regarding reporting requirements for cryptocurrency trading rewards and precious metal acquisitions.
Security measures protect your Growth Points balance. Enable two-factor authentication, use strong unique passwords, and remain vigilant against phishing attempts. Your accumulated points represent significant effort and value deserving proper protection.
Market conditions affect both trading profitability and point-earning potential. During high volatility periods, trading opportunities increase but so do risks. Balance aggressive point accumulation with prudent risk management to avoid losses that could offset reward values.
Long term Strategy Development
Treat Growth Points accumulation as a long-term endeavor rather than a quick scheme. Building sustainable habits around platform engagement yields better results than short-term intensive efforts followed by inactivity. Develop a personal system that integrates point-earning activities into your regular cryptocurrency involvement.
Set progressive goals beyond initial gold bar redemption. Many platforms offer tiered reward systems where continued participation unlocks increasingly valuable prizes. Understanding the full reward spectrum helps maintain motivation and provides direction for ongoing activity planning.
Evaluate the opportunity cost of time spent earning Growth Points against alternative activities. While gold bars provide tangible value, ensure your overall cryptocurrency strategy remains balanced and aligned with broader financial objectives. Growth Points should complement rather than dominate your platform interaction.
Network effects can amplify your earning potential. Building relationships with other active users creates opportunities for collaboration on referral programs, information sharing about events, and collective participation in group challenges. These connections enhance both point earnings and overall platform experience.
repost-content-media
  • Reward
  • 5
  • Repost
  • Share
MasterChuTheOldDemonMasterChu:
DYOR 🤓 🤓
View More
#StockTradingChallengeUpTo17000U
Comprehensive Stock Trading Challenge Guide: Strategies to Reach $17,000 and Build Long-Term Trading Success
Understanding the Trading Challenge Landscape
Stock trading challenges have become one of the most popular ways for traders to test their skills, demonstrate consistency, and potentially access larger pools of capital. Whether the objective is to pass a proprietary trading evaluation, achieve a personal financial milestone, or compete for rewards worth up to $17,000, success requires far more than simply predicting market direction.
Most trading challen
HighAmbition
#StockTradingChallengeUpTo17000U
Comprehensive Stock Trading Challenge Guide: Strategies to Reach $17,000 and Build Long-Term Trading Success
Understanding the Trading Challenge Landscape
Stock trading challenges have become one of the most popular ways for traders to test their skills, demonstrate consistency, and potentially access larger pools of capital. Whether the objective is to pass a proprietary trading evaluation, achieve a personal financial milestone, or compete for rewards worth up to $17,000, success requires far more than simply predicting market direction.
Most trading challenges are designed to measure discipline rather than luck. Participants must generate profits while respecting strict risk controls, daily loss limits, maximum drawdown restrictions, and minimum trading activity requirements. These rules simulate professional trading conditions where preserving capital is just as important as generating returns.
Many traders enter challenges believing aggressive trading will accelerate profits. In reality, the opposite is often true. The traders who consistently succeed are those who focus on protecting capital, managing emotions, and executing high-quality setups repeatedly. Reaching a $17,000 target is not about finding one extraordinary trade. It is about accumulating small advantages over time.
Risk Management: The Foundation of Success
Risk management remains the single most important factor in trading success. Even the best technical strategy will eventually fail if risk is not controlled properly. Professional traders understand that preserving capital allows them to survive losing streaks and continue participating when opportunities arise.
A widely accepted rule is to risk no more than one percent to two percent of total account equity on any individual position. This approach prevents a small series of losses from causing irreversible damage to the account.
Position sizing should always be calculated before entering a trade. Determine the maximum dollar amount you are willing to lose, identify the stop-loss location, and calculate the appropriate position size accordingly. This process removes guesswork and ensures consistency across different market environments.
Maximum daily loss limits are equally important. If you lose a predetermined amount during a trading session, stop trading immediately. Continuing to trade after reaching emotional frustration often leads to poor decisions and unnecessary losses.
Successful traders think like risk managers first and profit seekers second. Their priority is survival. Profits become a natural consequence of consistently following a sound process.
Technical Analysis Strategies
Technical analysis provides the framework for identifying opportunities and timing entries. While no indicator is perfect, combining multiple tools increases the probability of success.
Moving averages remain among the most effective trend-identification tools. The fifty-day and two-hundred-day moving averages help determine whether a stock is operating within a long-term bullish or bearish environment. Stocks trading above both averages generally offer more favorable long opportunities.
Shorter-term traders often use five-period, eight-period, and thirteen-period moving averages to identify momentum shifts.
Crossovers between these averages can signal potential trend changes and entry opportunities.
Support and resistance levels play a critical role in market structure analysis. Support zones represent areas where buyers have historically entered the market, while resistance zones represent areas where sellers have previously gained control.
Volume analysis significantly enhances technical interpretation. Breakouts supported by strong volume are generally more reliable than those occurring on weak participation. Institutions leave footprints through volume, and understanding these footprints provides valuable insight into market direction.
Chart patterns such as flags, triangles, double bottoms, and cup-and-handle formations often precede substantial price movements. Learning to recognize these structures can improve timing and confidence when entering positions.
Swing Trading and Momentum Approaches
Swing trading remains one of the most practical approaches for traders pursuing challenge targets. Unlike day trading, swing trading does not require constant screen monitoring and allows positions to benefit from multi-day trends.
Momentum trading focuses on stocks exhibiting exceptional relative strength compared to the broader market. These stocks often attract institutional attention and can produce substantial gains over relatively short periods.
The pullback strategy remains one of the highest-probability momentum techniques. Rather than chasing rapidly advancing stocks, traders wait for temporary retracements toward support levels before entering positions aligned with the primary trend.
Healthy trends rarely move in straight lines. Periodic pullbacks create opportunities for disciplined traders to enter at more favorable prices while maintaining attractive risk-reward ratios.
The MACD indicator can help confirm trend strength. Bullish crossovers accompanied by increasing volume often signal continuation opportunities, while bearish crossovers may warn of weakening momentum.
Patience is essential in momentum trading. Many traders lose money by entering positions after extended moves rather than waiting for proper setups.
Sector Rotation and Market Leadership
Understanding sector rotation can significantly improve trading performance. Different sectors outperform during different phases of economic and market cycles.
Technology, financials, and consumer discretionary sectors often lead during expansion phases. Healthcare, utilities, and consumer staples usually attract investors during uncertain periods.
Monitoring sector strength helps traders identify where institutional capital is flowing. Trading stocks within leading sectors generally improves the probability of success because these stocks benefit from favorable market conditions.
Trading Psychology and Emotional Control
Psychology represents the most underestimated component of trading success. Markets continuously test patience, discipline, confidence, and emotional stability.
Fear often causes traders to exit winning positions prematurely or avoid entering valid opportunities altogether. Greed encourages excessive position sizes and unrealistic expectations. Hope prevents traders from accepting losses when trades move against them.
Professional traders recognize these emotional tendencies and build systems designed to minimize their influence. Every trade should have predefined entry criteria, stop-loss levels, and profit objectives established before execution.
Maintaining a detailed trading journal provides valuable psychological insight. Recording trade rationale, emotional state, execution quality, and results helps identify recurring mistakes and behavioral patterns.
Consistency in execution matters more than individual trade outcomes. A perfectly executed losing trade is often more valuable than a poorly executed winning trade because proper execution reinforces positive habits.
Practical Trading Plans
A trading plan serves as a business blueprint. Without a plan, trading becomes speculation rather than a structured activity.
Your plan should clearly define markets traded, preferred setups, acceptable risk levels, trading hours, entry requirements, and exit strategies. Every decision should align with predefined rules.
Pre-market preparation is crucial. Review overnight developments, earnings reports, economic releases, and market sentiment. Create a watchlist of stocks demonstrating favorable technical characteristics and potential catalysts.
During market hours, focus only on opportunities matching your plan. Avoid distractions and resist the temptation to trade random price movements.
Post-market review is equally important. Analyze both winning and losing trades. Identify strengths, weaknesses, and opportunities for improvement.
Advanced Execution Techniques
Execution quality directly impacts profitability. Even strong analysis can produce poor results if trades are executed inefficiently.
Choosing the right order type improves execution quality and reduces trading errors. Scaling into positions reduces timing risk, while scaling out of profitable trades helps lock in gains and manage volatility.
Volume-weighted average price analysis can provide additional insight into institutional activity and short-term market strength.
Successful execution combines patience, preparation, and adaptability.
Common Mistakes to Avoid
Overtrading remains one of the most destructive habits among developing traders. More trades do not necessarily lead to more profits. Often, excessive activity reduces overall performance by increasing costs and lowering trade quality.
Ignoring stop losses can quickly transform manageable setbacks into major account damage. Accepting small losses is an essential part of professional trading.
Revenge trading after losses frequently leads to emotional decision-making and larger drawdowns. When frustration appears, step away from the market and regain composure.
Many traders also make the mistake of focusing exclusively on profits while ignoring process quality. Consistent execution ultimately produces sustainable results.
Building Sustainable Long-Term Success
The ultimate goal should extend beyond passing a challenge or earning a reward. Successful traders build skills capable of generating opportunities for years.
Continuous education remains essential because markets constantly evolve. Study charts, review past trades, and refine your methods regularly.
Strong routines, discipline, patience, and adaptability create the foundation for lasting success.
Final Thoughts on Reaching Your $17,000 Target
Achieving $17,000 in trading profits is entirely possible, but it requires a professional approach. Success depends on effective risk management, disciplined execution, technical competence, emotional control, and continuous self-improvement.
Focus on preserving capital, following your trading plan, and executing only the highest-quality opportunities. Avoid the temptation to force profits or chase market movements. Consistency, rather than aggression, remains the most reliable path toward substantial trading gains.
Every successful trader started with the same challenge: learning how to navigate uncertainty while managing risk. By combining strong technical skills with disciplined psychology and structured risk management, you place yourself in the best possible position to reach your trading objectives and build sustainable long-term success in the financial markets.
repost-content-media
  • Reward
  • 6
  • Repost
  • Share
MasterChuTheOldDemonMasterChu:
DYOR 🤓 🤓
View More
#USIranNegotiationGame
The US–Iran Negotiation Game has evolved into one of the most dominant macro forces shaping global financial markets in 2026, and it now functions not as a conventional diplomatic dispute but as a continuous geopolitical pricing engine that directly transmits risk into oil, gold, Bitcoin, equities, and currency markets, where every statement, every sanction update, every military escalation, and every diplomatic negotiation cycle is instantly interpreted by global traders as a signal for capital reallocation across risk and safe-haven assets.
This environment has create
HighAmbition
#USIranNegotiationGame
The US–Iran Negotiation Game has evolved into one of the most dominant macro forces shaping global financial markets in 2026, and it now functions not as a conventional diplomatic dispute but as a continuous geopolitical pricing engine that directly transmits risk into oil, gold, Bitcoin, equities, and currency markets, where every statement, every sanction update, every military escalation, and every diplomatic negotiation cycle is instantly interpreted by global traders as a signal for capital reallocation across risk and safe-haven assets.
This environment has created a world where markets no longer move purely on earnings, monetary policy, or traditional supply-demand fundamentals, but instead operate under a geopolitical volatility regime where headlines define short-term direction and macro positioning defines long-term structure.
Core Geopolitical Structure of the US–Iran Conflict
The confrontation between the United States and Iran is built on a multi-layered strategic framework where economic pressure, military signaling, and regional influence all operate simultaneously.
The United States continues to apply pressure through sanctions targeting Iran’s oil exports, shipping logistics, banking systems, and international financial access, effectively restricting Iran’s ability to integrate into the global financial system.
Iran, in response, continues to maintain strategic leverage through nuclear enrichment programs, proxy networks across the Middle East, and its critical geographic control over energy transportation routes, especially the Strait of Hormuz, which remains one of the most important global chokepoints for oil and LNG flows.
This creates a self-reinforcing cycle where escalation leads to sanctions, sanctions lead to counter-moves, and counter-moves feed back into global market volatility.
Strait of Hormuz: The Global Energy Pressure Valve
The Strait of Hormuz has become the single most important geopolitical asset in global energy markets because nearly one-fifth of global oil supply passes through this narrow maritime corridor.
Even partial disruption or increased military tension in this region immediately results in:
Higher shipping insurance premiums
Slower tanker movement and rerouting delays
Reduced effective global supply availability
Immediate repricing of crude oil futures
This is why oil markets now price not only actual supply but also probability of disruption, creating a permanent geopolitical risk premium embedded into global energy prices.
Global Oil Market Structure and Current Pricing Reality
As of current market conditions:
Brent crude oil is trading near $96.5 per barrel
WTI crude oil is trading near $92.5 per barrel
These levels confirm that oil is no longer in a neutral supply-demand environment but instead operating in a geopolitically distorted pricing regime where risk premiums dominate price discovery.
Oil has effectively transitioned from a commodity into a hybrid geopolitical asset where military developments, sanctions updates, and diplomatic negotiations matter more than production changes in determining short-term price direction.
The Brent-WTI spread continues to reflect global risk segmentation, where Brent carries the full geopolitical premium while WTI remains partially supported by domestic US production resilience.
Oil Market Forecast Framework
The oil market is currently structured around three major scenarios:
In a bullish escalation scenario where geopolitical tensions intensify further or the Strait of Hormuz faces additional disruption, Brent crude could move toward $105 to $115, while WTI could trade above $100 to $105, reflecting extreme supply risk repricing.
In a base case scenario where tensions remain elevated but partially contained through intermittent diplomatic engagement, Brent is expected to remain within $92 to $100, while WTI stays within $88 to $95, maintaining a high-volatility equilibrium range.
In a de-escalation scenario where diplomatic progress leads to gradual normalization of maritime flows, Brent could retreat toward $80 to $85, while WTI could stabilize near $78 to $84, reflecting partial removal of geopolitical risk premium.
Inflation Transmission and Global Monetary Policy Impact
Oil at elevated levels directly feeds into global inflation dynamics because energy costs sit at the foundation of transportation, logistics, industrial production, and consumer pricing structures.
When Brent remains near $96.5, the impact is transmitted across multiple channels:
Higher gasoline prices in global consumer markets
Rising diesel costs impacting freight and logistics networks
Increased airline fuel expenses affecting travel costs
Elevated petrochemical input costs impacting manufacturing
This creates a secondary inflation wave that central banks must respond to even if core inflation metrics appear stable in the short term.
As a result, oil has become a direct input variable in monetary policy forecasting, where every sustained movement in crude prices forces revisions in CPI expectations, bond yields, and currency valuation models.
Gold Market: Structural Safe-Haven Accumulation
Gold continues to function as the primary global hedge against both inflation persistence and geopolitical instability.
With oil trading near elevated levels, gold benefits from dual macro support:
Inflation protection demand
Geopolitical uncertainty premium
Central bank diversification flows
Weak real yield environment support
Gold remains structurally elevated in this cycle because global markets are simultaneously facing multiple risk layers rather than a single isolated shock.
Current gold levels near $4,530 per ounce reflect this sustained demand, and price action continues to show accumulation behavior during uncertainty spikes.
Forecast ranges remain broad, with bullish escalation scenarios pushing toward $4,900 to $5,050, while de-escalation phases could temporarily pull prices back toward $4,300 to $4,400, although long-term structural demand remains intact.
Bitcoin Market: Liquidity-Driven Macro Asset
Bitcoin continues to trade as a macro-sensitive digital asset that reacts primarily to liquidity cycles, institutional flows, and risk sentiment rather than purely acting as an inflation hedge.
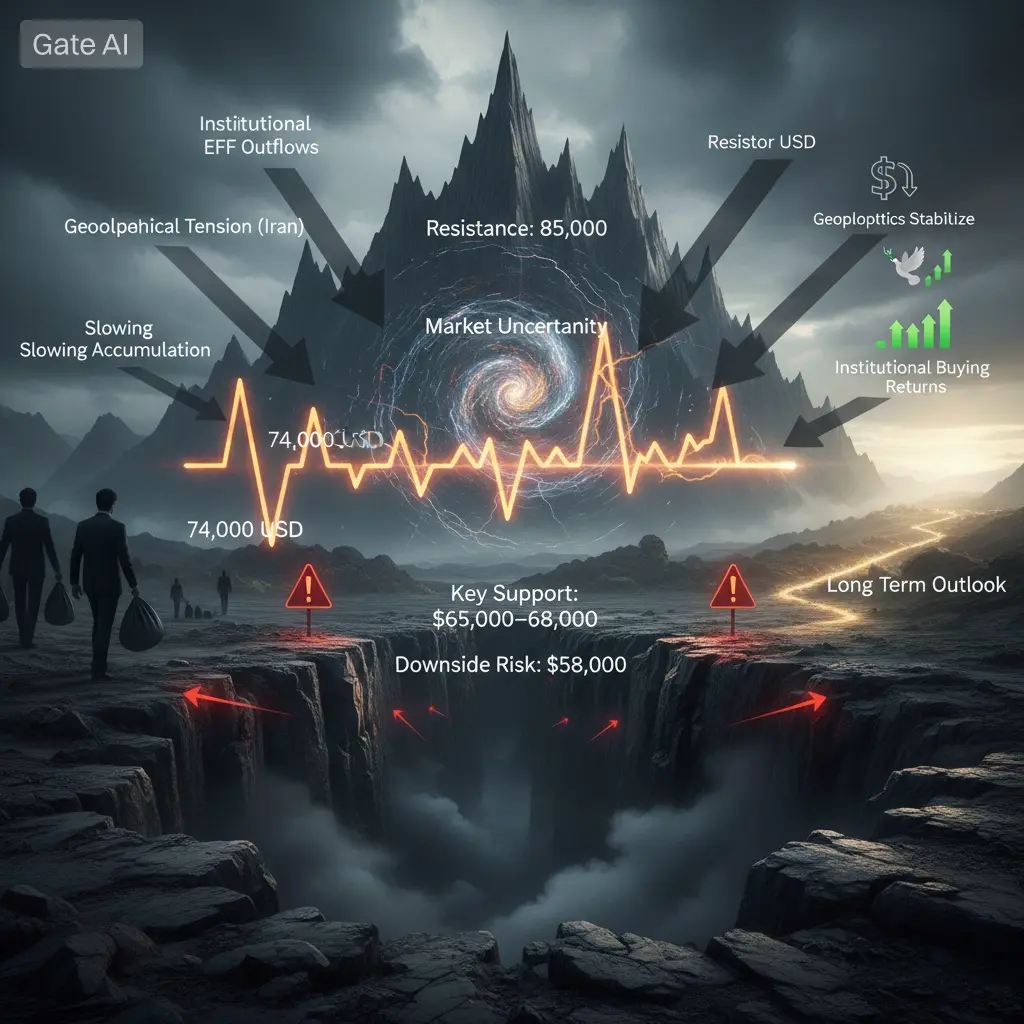
Current Bitcoin price stands near $74,030, reflecting a market caught between competing macro forces.
On one side, geopolitical uncertainty increases demand for alternative assets outside traditional financial systems, while on the other side, institutional ETF outflows, miner selling pressure, and tightening liquidity conditions continue to suppress sustained upward momentum.
Bitcoin is currently oscillating within a structural range where macro uncertainty prevents breakout momentum while also preventing deep structural collapse due to long-term institutional adoption trends.
Ethereum, XRP, and Solana: High-Beta Macro Instruments
Ethereum at $2,080, XRP at $1.34, and Solana near $82.5 are all functioning as higher-beta extensions of Bitcoin’s macro behavior.
Ethereum reflects liquidity cycles and ecosystem activity, while Solana and XRP react more aggressively to speculative sentiment shifts.
These assets tend to amplify Bitcoin’s direction rather than lead independent cycles, making them highly sensitive to geopolitical headlines and macro liquidity changes.
Interconnected Global Market System
The most important structural feature of 2026 markets is that all major asset classes are now deeply interconnected under the US–Iran geopolitical framework.
Rising oil leads to inflation expectations, which supports gold and sometimes Bitcoin under hedging narratives, while simultaneously pressuring equities and tightening monetary policy expectations.
Falling oil supports risk-on sentiment, strengthens the US dollar, and temporarily reduces demand for safe-haven assets.
Escalation events trigger immediate capital rotation into gold and crypto, while diplomatic breakthroughs temporarily reverse hedging flows.
This creates a synchronized macro system where no asset class moves independently anymore.
Crypto Market Under Geopolitical Pressure
Cryptocurrencies have effectively become real-time geopolitical sentiment indicators.
During escalation phases, Bitcoin and major altcoins experience inflows as investors seek alternative stores of value, while during diplomatic stabilization phases, capital rotates back into equities and fiat liquidity systems.
Stablecoins also see increased demand during periods of uncertainty as traders seek dollar exposure outside traditional banking channels.
Ethereum, Solana, and XRP continue to follow Bitcoin’s macro direction but with amplified volatility due to lower liquidity depth and higher speculative exposure.
Macro Trading Strategy Environment
The current environment is a high-volatility macro trading regime where headlines dominate technical structure.
Bitcoin strategy revolves around buying deep dips near structural support zones and reducing exposure during euphoric spikes near resistance levels.
Ethereum remains range-bound and should be accumulated on macro dips while avoiding excessive leverage due to unpredictable geopolitical volatility.
Oil remains the most reactive instrument, where geopolitical news drives sharp intraday swings, making breakout and reversal trading strategies more effective than long-term positioning.
Gold continues to function as the primary hedge asset, with accumulation favored during dips and profit-taking occurring during extreme spikes.
Global Supply Chain and Hidden Inflation Layer
Beyond financial markets, real-world supply chains are experiencing structural stress due to shipping disruptions, rerouting costs, insurance premiums, and logistical inefficiencies.
Trade routes through the Middle East remain partially constrained, Asia-Europe freight costs remain elevated, and alternative transport corridors are being utilized more frequently at higher cost.
This creates a hidden inflation layer that is not always visible in headline economic data but significantly impacts global production and pricing structures.
Structural Outlook for Q3 2026
The global macro outlook remains dominated by uncertainty and geopolitical sensitivity.
Markets are not trending in a traditional sense but are instead oscillating between fear and relief cycles driven by geopolitical developments.
Bitcoin is expected to remain within a broad structural range, Ethereum within a volatility band, oil within a high-risk geopolitical corridor, and gold at elevated structural levels.
Until a durable US–Iran resolution is achieved, global markets will continue operating under a regime of elevated volatility where geopolitical risk is the primary pricing mechanism across all major asset classes.
Final Macro Interpretation
The US–Iran Negotiation Game has transformed into a full-scale global macro control system where oil acts as the central transmission channel, gold functions as the systemic hedge anchor, and Bitcoin operates as the liquidity-sensitive risk indicator.
At Brent $96.5, WTI $92.5, Bitcoin near $74,030, Ethereum around $2,080, and gold at $4,530, global markets are clearly signaling a world defined not by stability but by persistent uncertainty and continuous repricing.
Until geopolitical conditions stabilize, markets will remain in a high-volatility macro regime where every headline has the power to reshape global financial flows within minutes, making this one of the most sensitive and interconnected market environments in modern financial history.
repost-content-media
  • Reward
  • 4
  • Repost
  • Share
MasterChuTheOldDemonMasterChu:
Just charge forward 👊
View More
#IntroducingGateStocks
Introducing Gate Stocks: A Comprehensive Guide to Gate xStocks Trading Section
Gate is one of the world's leading cryptocurrency exchanges, founded in 2013 by Dr. Han. Over the past decade, Gate has established itself as a trusted platform serving over 30 million users globally, offering access to more than 3,600 digital assets. The platform pioneered the industry's first 100 percent proof-of-reserves system and has consistently ranked among the top exchanges worldwide, currently holding the position of second globally in spot trading volume.
In July 2025, Gate official
HighAmbition
#IntroducingGateStocks
Introducing Gate Stocks: A Comprehensive Guide to Gate xStocks Trading Section
Gate is one of the world's leading cryptocurrency exchanges, founded in 2013 by Dr. Han. Over the past decade, Gate has established itself as a trusted platform serving over 30 million users globally, offering access to more than 3,600 digital assets. The platform pioneered the industry's first 100 percent proof-of-reserves system and has consistently ranked among the top exchanges worldwide, currently holding the position of second globally in spot trading volume.
In July 2025, Gate officially launched its xStocks trading section, marking a significant milestone in the platform's evolution. This new feature bridges the gap between cryptocurrency finance and traditional global capital markets, allowing users to trade tokenized stocks directly using USDT and other crypto assets. The launch represents Gate's strategic vision of creating a truly global, borderless investment platform that empowers users to access financial opportunities worldwide.
Understanding Gate xStocks
Gate xStocks is a specialized trading section that enables users to invest in tokenized versions of popular U.S. stocks. These tokenized assets represent real-world stocks from major companies but are traded on the blockchain using cryptocurrency. The system operates on a compliant, asset-backed tokenization model where all tokens are fully collateralized and represent publicly traded U.S. stocks. These tokens are freely transferable and compatible across multiple blockchains and ecosystems.
The initial launch included eight popular tokenized stocks: COINX representing Coinbase, NVDAX representing NVIDIA, CRCLX representing Circle, AAPLX representing Apple, METAX representing Meta Platforms, HOODX representing Robinhood, TSLAX representing Tesla, and GOOGLX representing Alphabet. Additionally, the Gate Alpha section expanded support to include MSTRx for MicroStrategy, SPYx for the S&P 500 ETF, and other strategic trading options.
How Gate xStocks Works
The xStocks trading section offers three primary trading methods to accommodate different investment strategies and risk appetites. First, the Spot Trading section allows users to directly buy and hold tokenized stock assets. For example, if an investor wishes to purchase Apple stock, they simply select the AAPLX/USDT trading pair and place their order. This method is ideal for long-term investors who prefer to accumulate and hold positions.
Second, the Contracts section enables futures trading with leverage support. This feature allows experienced traders to execute two-way strategies, meaning they can profit from both rising and falling markets. Users can apply leverage to their positions, amplifying potential returns while managing risk more dynamically. This approach suits swing traders and those employing short-selling strategies.
Third, the Alpha section provides advanced trading strategies and access to newly launched tokens with high growth potential. This area is designed for sophisticated users who have developed market judgment and wish to capture greater profit opportunities through strategic operations on volatile new assets.
Key Advantages of Gate xStocks
The xStocks platform offers several distinctive advantages that set it apart from traditional stock brokers. Most notably, Gate provides 24/7 uninterrupted trading, removing the constraints of traditional stock market hours including pre-market and after-hours limitations. This continuous availability allows global users to react to market events instantly, regardless of their time zone.
Another significant benefit is the elimination of traditional barriers. Unlike conventional brokers that require regional accounts, complex know-your-customer procedures, and fiat currency settlement, Gate's tokenized stocks are globally accessible without extensive KYC requirements. Users can invest using USDT directly, bypassing the need to exchange cryptocurrency for fiat currency or access traditional banking systems. This borderless trading model significantly lowers entry barriers for international participants.
The platform also supports fractional investment, enabling users to purchase portions of high-value stocks that might otherwise be inaccessible. Combined with on-chain liquidity, this feature democratizes access to premium assets and delivers a highly flexible, decentralized investment experience that seamlessly links traditional finance with decentralized finance.
Gate's Pioneering Achievement
Gate has achieved a world-first by launching the futures market for tokenized stocks. No other platform globally had previously offered leveraged futures trading on tokenized U.S. stocks. This innovation enables users to apply leverage and execute sophisticated two-way strategies on American stocks, all priced in USDT. The trading infrastructure has been comprehensively optimized for this launch, featuring upgrades to matching engines, pricing models, and risk control systems specifically tailored to the liquidity profiles of U.S. stocks and the behavioral patterns of crypto-native traders.
The result is a system delivering high responsiveness, strong compatibility, and robust user experience across both spot and futures markets. This infrastructure supports dynamic risk and return management, empowering traders with tools previously unavailable in the crypto space.
Strategic Significance and Future Vision
The expansion into tokenized stocks represents a crucial milestone in Gate's long-term strategy of bridging traditional and future finance. By building crypto-native infrastructure for traditional assets, Gate is fundamentally redefining how users access and interact with global capital markets. As the digital transformation of global finance accelerates, Gate's launch of tokenized stocks offers a model for the entire industry and demonstrates a pioneering approach to integrating decentralized infrastructure with traditional capital markets.
Dr. Han, Founder and CEO of Gate, articulated this vision stating that the mission extends beyond merely adding a new asset class. The goal is to transform the relationship between users and assets, creating a truly global, borderless investment platform that empowers everyone to access financial opportunities worldwide. This philosophy drives Gate's continuous innovation and expansion.
In 2025, Gate completed a major brand upgrade and transitioned to the unified domain Gate.com, marking a new chapter in its global strategy. The platform maintains continued strength in derivatives, liquidity depth, and user activity, reinforcing its position as a leader in global crypto financial infrastructure. Beyond core trading services, Gate's ecosystem includes Gate Wallet, Gate Ventures, and other innovative solutions, while its global partnerships extend to top-tier sports brands including Oracle Red Bull Racing in Formula One and Inter Milan football club.
Benefits for Traders and Investors
For cryptocurrency traders already familiar with Gate's interface, xStocks provides a seamless entry point into stock market investing without needing to open accounts with traditional brokers. The ability to diversify portfolios across both crypto and traditional assets within a single platform simplifies portfolio management and reduces operational complexity.
Investors gain exposure to established companies like Apple, Tesla, NVIDIA, and Meta while maintaining the flexibility and speed characteristic of cryptocurrency trading. The 24/7 availability means never missing market opportunities due to time zone differences or market closures. Additionally, the leverage options in futures trading provide sophisticated tools for risk management and return optimization that are typically reserved for institutional investors in traditional markets.
Conclusion
Gate xStocks represents a revolutionary development in the financial technology landscape, successfully merging the accessibility and innovation of cryptocurrency trading with the stability and familiarity of traditional stock markets. By tokenizing major U.S. stocks and making them available for continuous trading with crypto settlement, Gate has created a unique value proposition for the modern investor.
The platform's achievement as the first globally to offer futures markets for tokenized stocks demonstrates Gate's commitment to innovation and market leadership. As traditional finance and digital assets continue to converge, Gate xStocks positions the platform at the forefront of this transformation, offering users unprecedented access to global capital markets through a single, unified interface.
For traders seeking involvement in both cryptocurrency and traditional equity markets, Gate xStocks provides an integrated solution that eliminates traditional barriers while maintaining the security, liquidity, and functionality expected from a world-class trading platform. This development marks not just an expansion of Gate's offerings, but a fundamental shift in how global financial markets can be accessed and navigated in the digital age.@Gate_Square @Gate_Square @Gate广场_Official
repost-content-media
  • Reward
  • 6
  • Repost
  • Share
MasterChuTheOldDemonMasterChu:
DYOR 🤓 🤓
View More
#IntroducingGateStocks
🚀 Gate's real stock trading is officially launched!
It now supports $USDT direct trading of real stock assets, distinct from tokenization and synthetic exposure;
Compliance integration is provided by Alpaca, holding Broker-Dealer licenses and clearing qualifications~
*Gate App needs to be updated to version 8.21.5
U.S. stocks, with a new gateway 👇
https://www.gate.com/announcements/article/51452
HighAmbition
#IntroducingGateStocks
🚀 Gate's real stock trading is officially launched!
It now supports $USDT direct trading of real stock assets, distinct from tokenization and synthetic exposure;
Compliance integration is provided by Alpaca, holding Broker-Dealer licenses and clearing qualifications~
*Gate App needs to be updated to version 8.21.5
U.S. stocks, with a new gateway 👇
https://www.gate.com/announcements/article/51452
repost-content-media
  • Reward
  • 4
  • Repost
  • Share
MasterChuTheOldDemonMasterChu:
Just charge forward 👊
View More
#ArthurHayesSeesHYPEOvertakingSOL
Arthur Hayes’ HYPE vs SOL Flippening Thesis – Expanded Market Deep Dive (June 2026)
Arthur Hayes’ view that HYPE could eventually overtake SOL is becoming one of the most discussed relative-value narratives of this cycle. It is not just a price comparison story, but a structural debate between a buyback-driven perpetual DEX economy versus a mature Layer-1 smart contract network moving into institutional adoption.
Current Market Snapshot
HYPE is trading in the $62–$73 range with an approximate $15B circulating market cap and around $54B FDV. Only ~22% of total
HYPE5.78%
SOL-2.24%
HighAmbition
#ArthurHayesSeesHYPEOvertakingSOL
Arthur Hayes’ HYPE vs SOL Flippening Thesis – Expanded Market Deep Dive (June 2026)
Arthur Hayes’ view that HYPE could eventually overtake SOL is becoming one of the most discussed relative-value narratives of this cycle. It is not just a price comparison story, but a structural debate between a buyback-driven perpetual DEX economy versus a mature Layer-1 smart contract network moving into institutional adoption.
Current Market Snapshot
HYPE is trading in the $62–$73 range with an approximate $15B circulating market cap and around $54B FDV. Only ~22% of total supply is currently unlocked, creating a highly concentrated supply structure. The next major unlock event on June 6, 2026, is a key short-term volatility trigger.
SOL trades near $81–$83 with a ~$40B circulating market cap and similar FDV structure around ~$54B. Unlike HYPE, SOL has a fully circulating supply, meaning price movement is driven almost entirely by demand-side capital flows rather than scheduled supply expansion.
Hyperliquid’s Structural Buyback Engine
The strongest pillar behind the HYPE narrative is its self-reinforcing fee capture system. The Assistance Fund receives nearly all protocol revenue and deploys it into continuous HYPE buybacks on the open market.
Key structural implications:
Persistent bid pressure regardless of sentiment cycles
Revenue-to-market-cap absorption significantly higher than most large caps
Reduced reliance on external speculative inflows
Strong reflexivity loop between volume growth and price support
With over $1.16B in cumulative revenue and strong annualized activity, Hyperliquid behaves more like a cash-flow-linked crypto asset rather than a purely speculative token.
Ecosystem Expansion: HIP-3 and HIP-4 Impact
Recent protocol expansion has widened Hyperliquid’s addressable market beyond perpetual futures.
HIP-3 introduces tokenized equities and commodities, increasing institutional-style exposure inside the protocol
HIP-4 enables prediction markets with collateralized event contracts, adding new speculative and hedging demand
Unified margining across assets increases capital efficiency and reduces fragmentation
These upgrades create a multi-vertical trading ecosystem, positioning Hyperliquid closer to a decentralized financial exchange layer rather than a single-product DEX.
SOL: Strengths and Structural Headwinds
SOL remains one of the most important high-performance Layer-1 networks, with strong institutional adoption through ETFs and tokenized real-world assets.
Positive drivers:
ETF inflows showing steady institutional interest
Growth in RWA tokenization via major funds
Strong developer ecosystem and established infrastructure
However, short-term market structure shows:
Reduced speculative trading intensity compared to prior cycle highs
Stagnant futures open interest around $5B levels
Capital rotation toward other ecosystems in certain segments
Key support clustering near $77 and $68 zones
SOL’s narrative is increasingly shifting from high-beta growth to institutional infrastructure asset, which often compresses volatility but stabilizes long-term valuation.
Relative Value Dynamics: Why the Comparison Matters
The key argument behind Hayes’ thesis is not absolute performance, but relative capital efficiency.
HYPE characteristics:
Low float, high velocity supply dynamics
Continuous buyback absorption
Strong reflexive feedback loop between volume and price
SOL characteristics:
Large-cap, high liquidity, macro-sensitive asset
Demand driven by ecosystem adoption and institutional flows
Less direct supply-side price support mechanism
This creates a structural contrast:
HYPE behaves like a synthetically deflationary flow asset, while SOL behaves like a broad-based infrastructure equity equivalent in crypto form.
Flippening Conditions (Scenario-Based)
For HYPE to overtake SOL in circulating market cap:
HYPE must sustain $100–$150 range expansion
Buyback intensity must remain proportional or increase with volume
HIP-3/4 adoption must significantly expand trading activity
SOL must remain range-bound or face capital rotation pressure
At $150 HYPE valuation, circulating market cap
would approach ~$38B, requiring either:
SOL stagnation near $25B–$40B effective range compression, or
Significant relative underperformance in capital inflows
Risk Factors and Bear Case Considerations
For HYPE:
Unlock events increasing sell-side pressure
Competition from centralized exchanges or alternative perp DEXs
Revenue deceleration if trading volumes normalize
Over-reliance on derivatives activity cycles
For SOL:
Extended consolidation reducing speculative attention
Narrative shift away from retail-driven momentum
Market rotation into newer high-beta ecosystems
Trading Strategy Outlook
HYPE positioning:
Accumulation zones: $60–$65 range
Breakout trigger: sustained volume expansion above ATH structure
Target scenario: $100–$150 cycle extension
Risk management: unlock event volatility window
SOL positioning:
Accumulation zones: $77 and $68.5 support region
Recovery targets: $100–$147 structural rebound range
Strategy: long-term institutional hold or range accumulation
Relative trade idea:
Long HYPE / Short SOL remains a high-beta relative-value expression of this thesis
Key monitoring: ETF flows, perp volume, and buyback rate divergence
Hayes’ thesis is fundamentally a liquidity and structure argument, not just a price prediction. HYPE’s strength lies in engineered demand through fee recycling, while SOL’s strength lies in ecosystem maturity and institutional integration.
The most realistic outcome is continued HYPE relative outperformance, narrowing the valuation gap over time. However, a full market cap flippening requires sustained execution, favorable macro conditions, and prolonged divergence in capital flows between the two ecosystems.
repost-content-media
  • Reward
  • 5
  • 1
  • Share
User_any:
To The Moon 🌕
View More
#SaylorHintsAtMoreBTC
Bitcoin remains at a critical inflection point as Michael Saylor's Strategy continues to shape market sentiment through its massive BTC treasury operations. Strategy currently holds approximately 818,869 BTC acquired for roughly $61.86 billion at an average cost near $75,540 per coin, representing almost 4% of Bitcoin's total supply. The company accumulated more than 145,000 BTC during 2026, reinforcing its position as the largest corporate Bitcoin holder and one of the most influential sources of market demand.
Strategy's Evolution: From Pure Accumulator to Treasury Man
BTC-3.19%
HighAmbition
#SaylorHintsAtMoreBTC
Bitcoin remains at a critical inflection point as Michael Saylor's Strategy continues to shape market sentiment through its massive BTC treasury operations. Strategy currently holds approximately 818,869 BTC acquired for roughly $61.86 billion at an average cost near $75,540 per coin, representing almost 4% of Bitcoin's total supply. The company accumulated more than 145,000 BTC during 2026, reinforcing its position as the largest corporate Bitcoin holder and one of the most influential sources of market demand.
Strategy's Evolution: From Pure Accumulator to Treasury Manager
The market narrative surrounding Strategy is gradually evolving. Earlier phases were defined by aggressive accumulation regardless of market conditions. Today, investors are increasingly focused on balance sheet sustainability, funding costs, and long-term capital management.
With approximately $15 billion in preferred obligations and significant annual dividend commitments, Strategy may eventually need to balance Bitcoin accumulation with broader treasury objectives. This does not necessarily weaken the long-term Bitcoin thesis, but it introduces a new layer of market analysis that traders cannot ignore.
The transfer of BTC to Coinbase Prime and growing market speculation have intensified discussions about future treasury operations. Whether these actions represent liquidity management, portfolio optimization, or preparation for future transactions, investors are closely monitoring every move.
Bitcoin Market Structure Remains Fragile
Bitcoin is currently trading around $73,500–$74,000 after experiencing a sharp correction from the October 2025 all-time high near $126,080.
Current market conditions reveal several important trends:
• ETF flows remain inconsistent and have recently shown notable outflows.
• Institutional demand indicators remain weaker than earlier cycle phases.
• Miner distribution continues to create additional supply pressure.
• Retail participation is gradually increasing despite overall market uncertainty.
• Volatility remains elevated due to global macroeconomic and geopolitical developments.
This combination typically creates an environment where liquidity hunts and sharp price swings become more common before a stronger directional trend emerges.
Market Psychology and Liquidity Dynamics
One of the most important observations is the divergence between retail and institutional behavior.
Retail participants appear increasingly optimistic after the recent correction, while many institutional indicators remain defensive. Historically, this type of divergence often occurs during transitional market phases where price seeks deeper liquidity before establishing a sustainable trend.
As long as institutional demand remains muted, Bitcoin may continue experiencing wide trading ranges rather than immediate trend acceleration.
Key Support Zones
$74,000 remains the most important near-term level.
Additional support areas include:
• $73,000 – Short-term breakdown trigger
• $65,000–$68,000 – Major long-term holder accumulation zone
• $58,000–$60,000 – Extreme liquidity sweep region under high-stress conditions
Key Resistance Levels
For bulls to regain control, Bitcoin must reclaim:
• $85,150 – First major recovery confirmation
• $87,000–$91,000 – Significant supply cluster
• $94,700 – Macro trend pivot level
• $126,080 – Previous cycle high
Until BTC establishes strength above $85,150, most rallies should be viewed as recovery attempts rather than confirmed trend reversals.
June 2026 Scenario Analysis
Base Case
The highest probability outcome remains continued consolidation between $68,000 and $85,000 as buyers and sellers compete for control.
Bullish Scenario
Several catalysts could drive renewed momentum:
• ETF inflows returning to positive trends
• Strategy maintaining accumulation activity
• Improving global liquidity conditions
• Reduced geopolitical uncertainty
• More accommodative central bank expectations
In this scenario, Bitcoin could reclaim $85,150, challenge $94,700, and eventually move back above $100,000. Longer-term cycle projections between $150,000 and $170,000 remain achievable if liquidity conditions improve significantly.
Bearish Scenario
Downside pressure could intensify if:
• ETF outflows continue
• Institutional demand remains weak
• Global liquidity tightens further
• Risk appetite deteriorates across financial markets
This could open the door for retests of $65,000–$68,000, with deeper liquidity sweeps toward $58,000 possible during periods of elevated market stress.
Why Saylor Still Matters
Regardless of short-term volatility, Strategy remains one of the most influential entities in the Bitcoin ecosystem. Every treasury decision now carries broader implications for market sentiment, liquidity expectations, and investor confidence.
The market is no longer focused solely on how much Bitcoin Strategy buys. Increasingly, traders are analyzing how Strategy manages capital, balances obligations, and adapts to changing market conditions.
June 2026 appears more likely to be a high-volatility transition phase than an immediate breakout month. Short-term risks remain elevated, particularly around institutional flows and macroeconomic uncertainty.
However, the long-term Bitcoin thesis remains constructive. If ETF demand stabilizes, global liquidity improves, and Strategy continues supporting the market through disciplined treasury management, Bitcoin could gradually transition from correction mode into the next expansion phase, creating a path back above $100,000 and potentially toward new cycle highs in the future.@Gate_Square @Gate广场_Official
repost-content-media
  • Reward
  • 5
  • Repost
  • Share
MasterChuTheOldDemonMasterChu:
DYOR 🤓 🤓
View More
#ETHSeesawsAround2000Level
Ethereum Price Analysis: The Critical $2000 Battleground
Ethereum is currently trading in a tight range around the psychologically significant $2000 level, with the market attempting to determine its next major directional move. This analysis provides a comprehensive examination of why ETH is consolidating at this crucial juncture, what factors are influencing price action, and where the market could head next.
Current Market Structure and Price Action
As of early June 2026, Ethereum is trading approximately at $2060, consolidating after rebounding from recent lows
HighAmbition
#ETHSeesawsAround2000Level
Ethereum Price Analysis: The Critical $2000 Battleground
Ethereum is currently trading in a tight range around the psychologically significant $2000 level, with the market attempting to determine its next major directional move. This analysis provides a comprehensive examination of why ETH is consolidating at this crucial juncture, what factors are influencing price action, and where the market could head next.
Current Market Structure and Price Action
As of early June 2026, Ethereum is trading approximately at $2060, consolidating after rebounding from recent lows near $1850 to $1880. The price action on the hourly timeframe reveals a recovery attempt into resistance rather than a confirmed breakout, with price compressing beneath the $2080 to $2120 region. This compression pattern indicates that market participants are in a state of indecision, with neither bulls nor bears able to establish clear dominance.
The $2000 level has emerged as the critical structural pivot for Ethereum. On the one-hour ETH chart, price is holding above this psychological threshold but remains capped below recent swing highs. For bullish confirmation to materialize, Ethereum would require sustained acceptance above the $2000 to $2026 zone, which is often associated with the 200-day exponential moving average region in broader trend analysis.
Why ETH Is Range-Bound at $2000
Several interconnected factors are contributing to Ethereum's consolidation around the $2000 level. First, institutional positioning has created a supply-demand equilibrium. Following record ETF inflows throughout 2026, institutional investors have established substantial positions, creating both support and resistance zones. The Pectra protocol upgrade has improved network efficiency, but the market is still digesting these technical improvements.
Second, whale accumulation has been quietly accelerating. Large holders are using the current price weakness to accumulate positions, which creates underlying demand that prevents deeper declines. However, this accumulation is occurring gradually rather than aggressively, contributing to the range-bound price action.
Third, the broader macro environment remains uncertain. While regulatory clarity has improved in certain jurisdictions, global economic conditions continue to create headwinds for risk assets. This uncertainty keeps many traders on the sidelines, reducing volatility and keeping price within established ranges.
Key Support Levels to Monitor
The immediate support structure for Ethereum is well-defined. The $2000 level itself serves as the primary psychological floor. Below this, immediate support clusters are located at $1950 to $1900, with specific demand zones at $1970, $1930, and stronger support at $2020 and $2090. A sustained break below $1970 could trigger liquidity sweeps toward the $1800s, specifically targeting $1850 and $1820.
The $1900 to $1800 range represents a critical accumulation zone where historical buying interest has been strong. If price were to decline into this region, it would likely attract significant institutional buying, potentially establishing a more durable bottom for the next leg higher.
Key Resistance Levels Ahead
Overhead supply remains heavy above current levels. Near-term resistance is situated at $2100 to $2150, with a reclaim of this zone potentially sparking short covering and momentum buying. The next resistance clusters appear at $2140, $2160, $2200, $2235, and $2270. Higher targets include the $2300 to $2390 premium zone and the psychologically important $2500 level.
The $2350 to $2400 zone represents particularly strong resistance, as this area has previously acted as a major turning point. Breaking above this level would signal a significant shift in market structure and likely attract substantial buying interest from both retail and institutional participants.
Technical Indicators and Divergence Patterns
Technical analysis reveals a hidden bullish divergence pattern that continues to hold on Ethereum charts. This divergence suggests that while price has been making lower lows, momentum indicators have been showing higher lows, indicating underlying strength that may not be immediately visible in price action alone.
The daily Ichimoku Cloud analysis shows Ethereum remains bearish below the cloud, with on-balance volume confirming downward pressure. However, the compression pattern suggests that this bearish momentum may be waning, setting up for a potential reversal if key resistance levels are reclaimed.
Bullish Scenario: Path to Higher Prices
The bullish case for Ethereum depends on several key developments. First, ETH must defend the $2000 level and establish it as reliable support. Second, a reclaim of $2150 with significant volume would signal that buyers have regained control and could spark a move toward $2220 to $2390. Third, breaking above $2500 would confirm stronger bullish momentum and open the path toward $2560 to $3150 projections for later in 2026.
Institutional adoption continues to grow, with staking activity tightening liquid supply and reinforcing Ethereum's value proposition. The network's position as the dominant platform for decentralized finance, stablecoins, and smart contract applications provides fundamental support for higher valuations.
Bearish Scenario: Risk of Further Declines
The bearish case centers on a failure to hold the $2000 support level. A four-hour close below $1970 would increase bearish risk significantly, opening the door to a decline toward $1850 to $1700. The broader TOTAL market cap chart remains strongly bearish beneath the daily cloud, suggesting that one final capitulation move may still be forthcoming.
Network activity metrics show some weakness, with transaction volumes and active addresses not yet confirming a strong recovery. If these metrics fail to improve, it would suggest that the current price level lacks strong fundamental support.
Market Sentiment and Community Outlook
Market sentiment around Ethereum remains cautiously optimistic. The crypto community on social platforms is closely watching the $2000 level as the line in the sand for June 2026. Traders widely view this level as the major psychological floor, with sentiment turning more bearish on any sustained break below.
The debate around Ethereum's value proposition continues, with some commentators noting that the network was designed to maximize value for applications and layer-2 networks rather than ETH holders directly. This architectural consideration has led some long-term holders to reassess their positions, though institutional interest remains strong.
June 2026 Outlook and Price Targets
For the immediate term, Ethereum appears range-bound between $1900 and $2200, with $2000 acting as the key structural pivot. AI models and macro analysis point to stabilization near $2100 to $2140 by early June, provided the $2000 level holds.
Looking ahead to the remainder of 2026, projections vary based on network activity and institutional participation. Conservative estimates suggest ETH could trade between $1975 and $2135 in the near term, while more optimistic scenarios target $2560 to $3150 if network activity and trading participation increase substantially.
The $10000 price target that some analysts have discussed would require a confluence of factors including sustained ETF demand, continued institutional adoption, stablecoin growth, and resurgent on-chain activity. While this target remains ambitious, the infrastructure is being laid for such a move over the coming years.
Conclusion
Ethereum's battle at the $2000 level represents a critical juncture for the market. The consolidation reflects a balance between institutional accumulation, technical improvements, and macro uncertainty. Bulls must defend $2000 and reclaim $2150 to establish a foundation for higher prices, while bears are watching for a break below $1970 to trigger deeper declines.
The path forward will likely be determined by whether Ethereum can translate its network improvements and institutional adoption into sustained price appreciation. For now, traders should monitor the key levels outlined above and remain prepared for either a breakout toward $2200 to $2400 or a breakdown toward $1800 to $1900.
@Gate_Square @Gate广场_Official
repost-content-media
  • Reward
  • 5
  • Repost
  • Share
MasterChuTheOldDemonMasterChu:
Just charge forward 👊
View More
  • Pinned