AYATTAC

vip
Age 0.5 Year
Peak Tier 5
Crypto enthusiast |\n\nSpot, Limit and Stop Loss trading made simple |\n\nEasy crypto lessons | Live streams to learn, grow, and trade smarter\n\ntogether
Pin
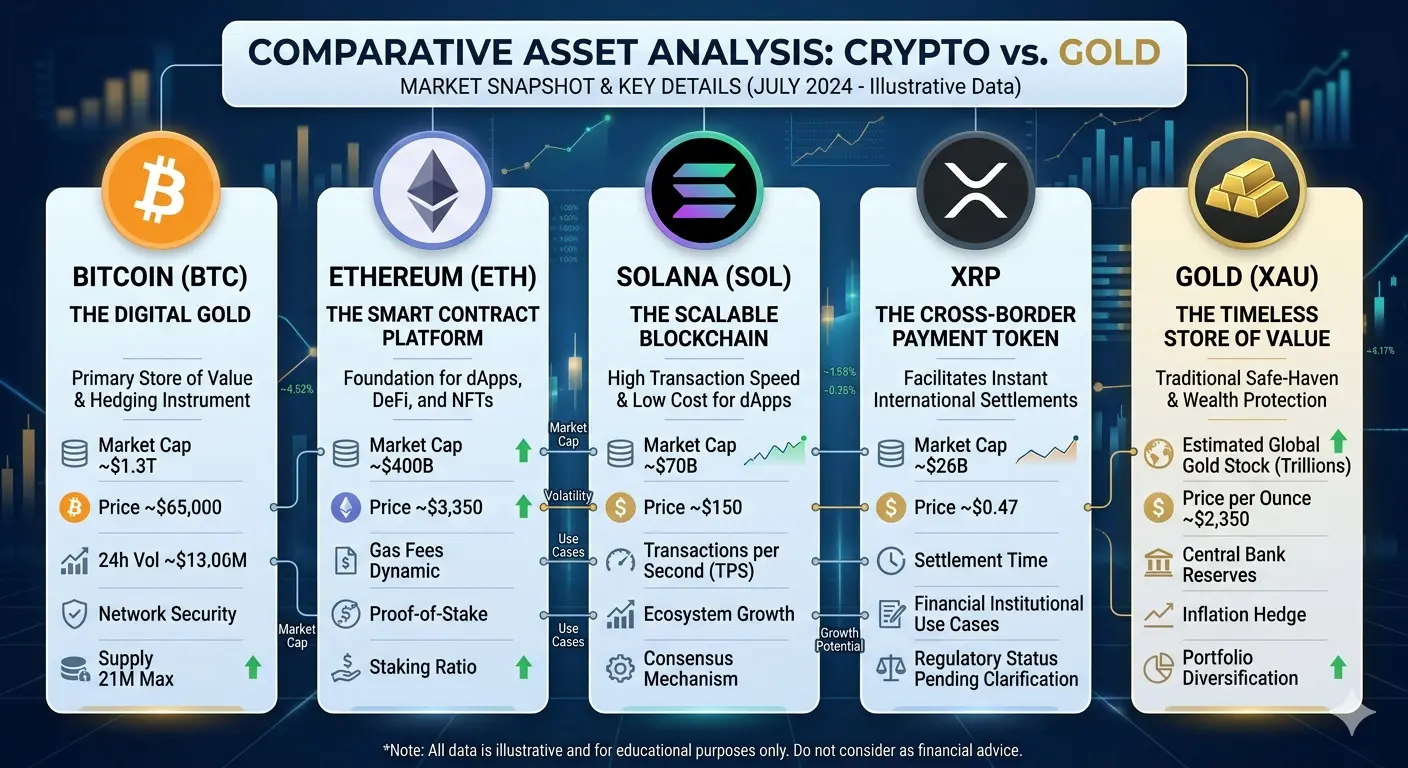
crypto market analysis
1,754 views
2026-04-18 15:36
  • Reward
  • 32
  • Repost
  • Share
cryptoStylish:
good work
View More
#StockTradingChallengeUpTo17000U #USIranNegotiationGame Gate Card Integrates Digital Assets into Daily Spending
From morning coffee and daily shopping to dining out, taking taxis, and lifestyle expenses, see how Gate users easily use digital assets to pay in real-life scenarios with Gate Card.
Highlight Features:
🔹 Up to 5% cashback on purchases
🔹 Earn BTC, ETH, USDT, or GT rewards with every transaction
🔹 Supports Apple Pay and Google Pay
🔹 Compatible with approximately 130 million Visa merchants worldwide
🔹 No annual fee, no monthly fee, no card application fee
Whether online or offline
BTC1.02%
ETH1.17%
GT0.29%
AngelEye
#USIranNegotiationGame Gate Card Integrates Digital Assets into Daily Spending
From morning coffee and daily shopping to dining out, taking taxis, and lifestyle expenses, see how Gate users easily use digital assets to pay in real-life scenarios with Gate Card.
Highlight Features:
🔹 Up to 5% cashback on purchases
🔹 Earn BTC, ETH, USDT, or GT rewards with every transaction
🔹 Supports Apple Pay and Google Pay
🔹 Compatible with approximately 130 million Visa merchants worldwide
🔹 No annual fee, no monthly fee, no card application fee
Whether online or offline, Gate Card makes digital asset payments more convenient and natural, truly bringing crypto assets into everyday life.
Apply for Gate Card now: https://www.gate.com/card?channel=8¤cy=USD
  • Reward
  • 8
  • Repost
  • Share
AngelEye:
1000x VIbes 🤑
View More
#WinGoldBarsWithGrowthPoints Gate Square Little Classroom 🧑‍🏫
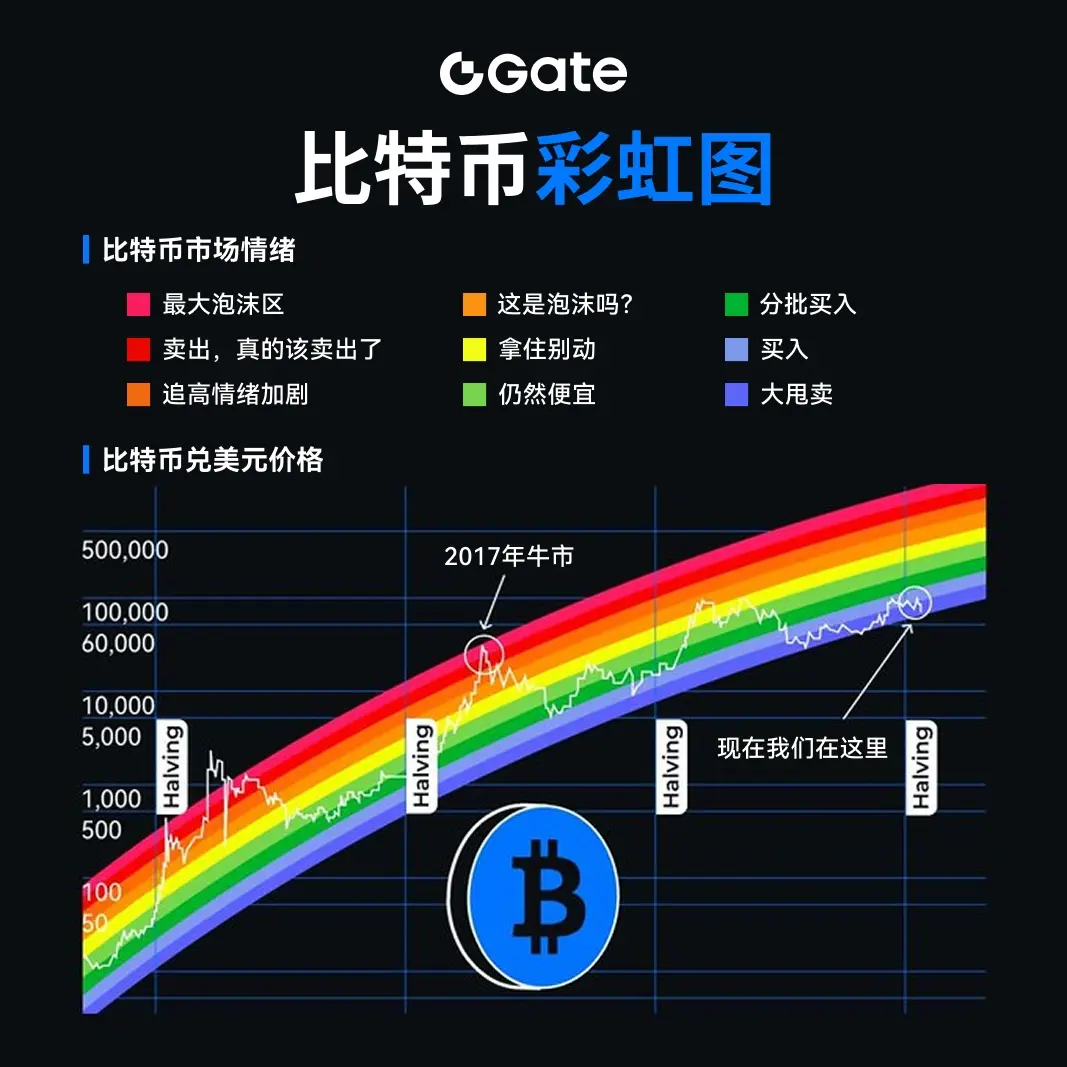
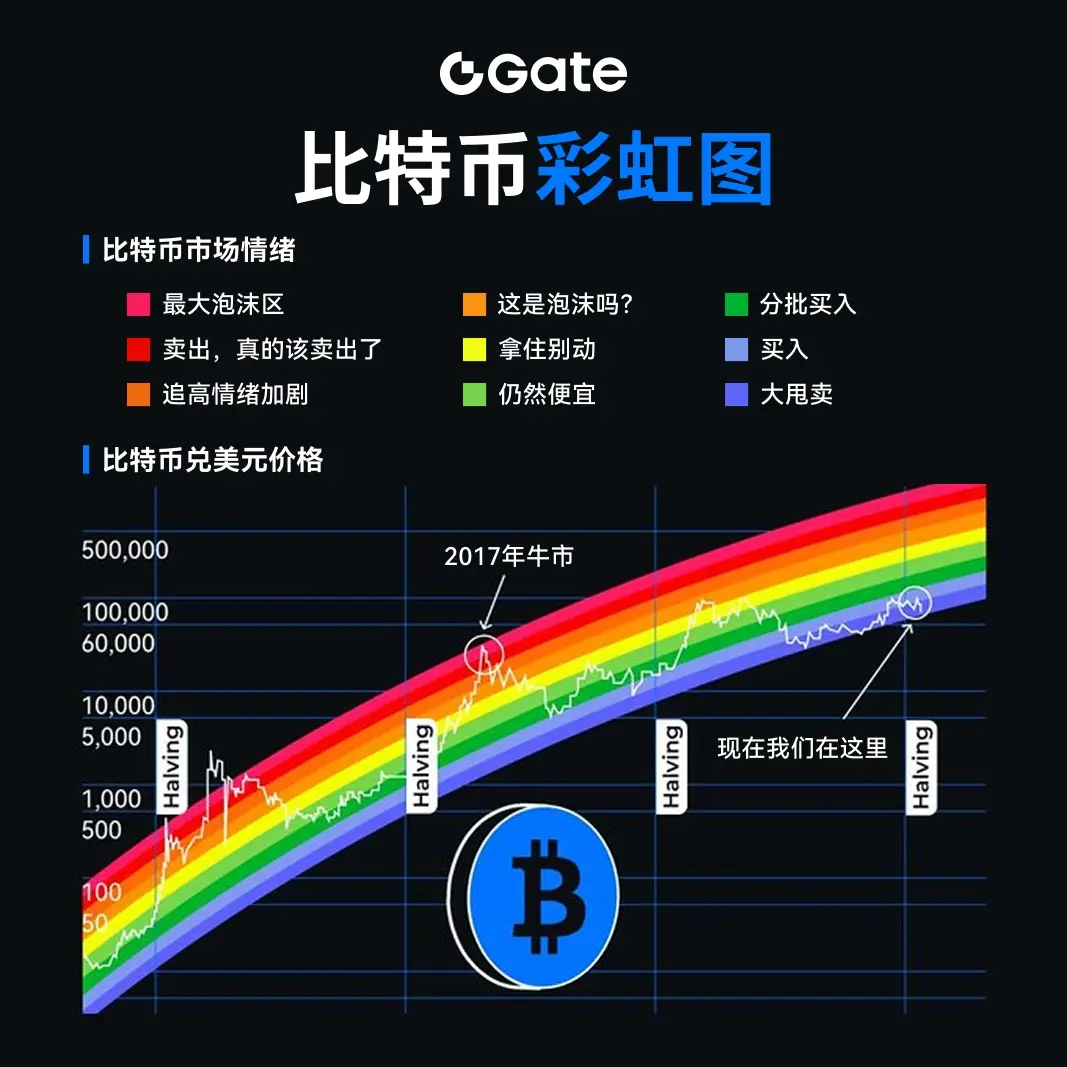
The Bitcoin Rainbow Chart is a tool that displays Bitcoin's long-term price trends and market sentiment through color-coded zones. From blue to red, they correspond to the "buy zone," "hold zone," and "bubble zone." The current price is near the "gradual buy-in" and "still cheap" areas, reflecting a cooler market sentiment. The rainbow chart is not used for short-term timing but is more suitable for helping long-term investors understand the cycle position.
BTC1.02%
post-image
post-image
Original content no longer visible
  • Reward
  • 7
  • Repost
  • Share
AngelEye:
1000x VIbes 🤑
View More
#AnthropicValuationHits965BillionDollars GM! Shine bright today! ☀️✨
Gate_Square
GM! Shine bright today! ☀️✨
repost-content-media
  • Reward
  • 6
  • Repost
  • Share
AngelEye:
1000x VIbes 🤑
View More
#CBOEIntroducesExtendedTradingForStockOptions #TradFi交易分享挑战
#TSM
TSMC is trading around $418.45, reflecting a mild daily decline of -1.51%, but this short-term softness does not change the broader structural strength of the trend. The stock continues to behave like a core leader in the global AI semiconductor cycle, where every dip is consistently met with institutional accumulation and strong demand absorption.
Recent price action confirms a controlled but powerful uptrend. The stock recorded an intraday high of $427.07 on May 29, followed by $422.22 on May 28, $427.02 on May 27, and a lowe
HighAmbition
#TradFi交易分享挑战
#TSM
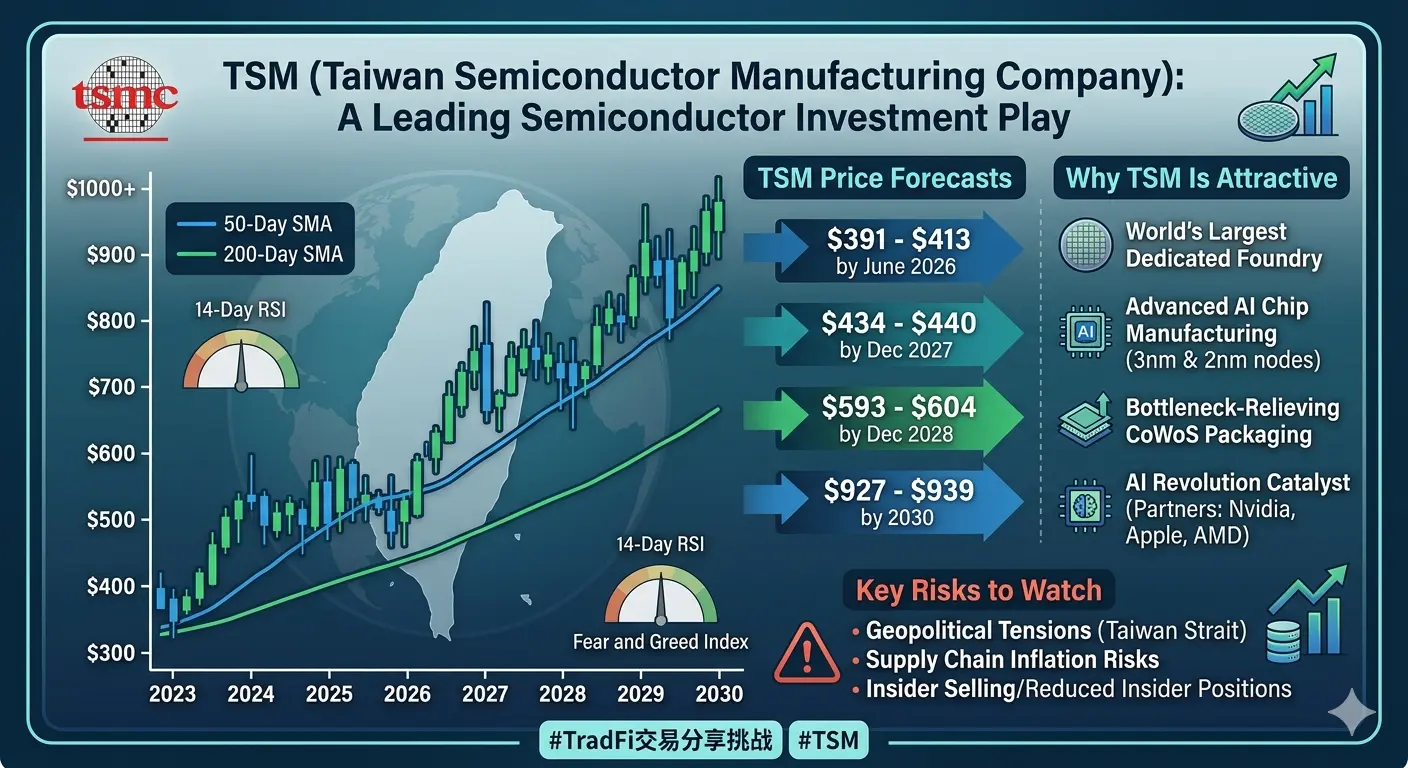
TSMC is trading around $418.45, reflecting a mild daily decline of -1.51%, but this short-term softness does not change the broader structural strength of the trend. The stock continues to behave like a core leader in the global AI semiconductor cycle, where every dip is consistently met with institutional accumulation and strong demand absorption.
Recent price action confirms a controlled but powerful uptrend. The stock recorded an intraday high of $427.07 on May 29, followed by $422.22 on May 28, $427.02 on May 27, and a lower base near $413.12 on May 26, showing that volatility remains present but fully within an upward channel. Earlier in the month, TSMC built support around $401.61 (May 4) and consolidated near $396.06–$393.83 in late April, forming a strong accumulation base before the latest breakout attempt.
Year-over-year performance stands near +34%, confirming that TSMC is not in a short-term rally but a sustained AI-driven expansion phase. The current zone between $410–$427 now represents a critical equilibrium area where the market is deciding the next breakout direction.
Q1 2026 Financial Performance — AI Demand Acceleration
TSMC’s Q1 2026 results highlight a structural transformation rather than a normal semiconductor cycle. Net profit surged to TWD 572.5 billion (~$18.2 billion), marking a massive +58% YoY increase, driven almost entirely by AI semiconductor demand strength.
Revenue expanded more than 40% year-over-year, with advanced-node chips and AI infrastructure demand becoming the primary growth engine. The company further raised its full-year guidance to 30%+ revenue growth, signaling confidence that demand is not slowing but accelerating.
Capital expenditure was increased to $50–56 billion, reinforcing long-term expansion plans for advanced fabrication capacity. Forward projections suggest exponential scaling:
2026 Revenue: TWD 2.89 trillion
2027 Revenue: TWD 3.81 trillion
2028 Revenue: TWD 5.12 trillion
2029 Revenue: TWD 6.41 trillion
EPS projections also reflect aggressive growth expectations:
2026 EPS: $44.67
2027 EPS: $65.47
2028 EPS: $92.16
2029 EPS: $115.21
This trajectory confirms TSMC is deeply embedded in a long-duration AI infrastructure cycle, not a traditional semiconductor upswing.
Analyst Forecasts & Valuation Gap
Market analyst sentiment remains strongly bullish with a “Strong Buy” consensus, but price targets lag behind actual market movement due to rapid re-rating.
Average 12-month target: $387.14 (lagging indicator)
High target: $480
Low target: $210 (outdated bearish scenario)
Near-term projection: $431–$433
Extended bullish range: $460–$485
The gap between current price ($418+) and average analyst expectations highlights a key structural reality: Wall Street models are still adjusting to the speed of AI-driven semiconductor expansion.
Technical Analysis — Strong Trend Continuation
TSMC remains firmly above all major moving averages, confirming a strong bullish regime:
20-day EMA: $399.57
50-day EMA: $382.40
200-day EMA: $323.82
The golden cross structure supports long-term upward continuation. Bollinger Band positioning shows:
Upper band: $419.40
Mid band: $402.96
Lower band: $386.51
Price is currently near the upper band, indicating strength but also short-term extension risk
Momentum remains balanced:
RSI: ~58.79 (neutral bullish zone)
MACD: positive momentum continuation
Key levels remain:
Immediate support: $410.07
Pivot: $413.00
Resistance: $416.49–$419.40
Overall structure confirms trend continuation, not reversals
Institutional Positioning & AI Monopoly Narrative
TSMC continues to function as the global backbone of AI chip production. Institutional capital increasingly views it not as a cyclical semiconductor company but as a strategic AI infrastructure monopoly.
Key structural drivers include:
Dependence of NVIDIA, AMD, and Apple on advanced nodes
Hyperscaler capex exceeding $660B (2026 forecast)
CoWoS capacity expansion to 130,000 wafers/month
Arizona GigaFab expansion valued at $165B
Leadership in 3nm and upcoming 2nm node technology
This positions TSMC as the “picks-and-shovels” provider of the entire AI economy.
Price Scenarios — How High Can TSM Go?
Short-Term (2026):
Breakout above $427 → $435–$450
Momentum extension → $460–$480
Strong bull case → $500
Mid-Term (2027–2028):
Structural range: $500–$550
AI-driven expansion continuation
Long-Term Extreme Scenario:
If AI demand remains exponential: $550–$600+
Trading Strategy Framework
Short-Term Strategy:
Buy zone: $410–$416
Stop-loss: below $399 / $386
Targets: $430 → $450 → $460
Swing Strategy:
Accumulation: $395–$405 dips
Targets: $450–$480
Long-Term Strategy:
Core accumulation: $380–$400 zone
Cycle upside: $500–$550+
TSMC remains one of the most critical pillars of the global AI revolution, effectively controlling advanced semiconductor supply chains that power the entire artificial intelligence ecosystem. At $418+, the stock reflects strong fundamentals, institutional confidence, and sustained AI-driven demand momentum.
The overall structure remains decisively bullish, with short-term consolidation acting as a base for potential continuation toward $450–$500 in 2026, and possibly $550+ in the broader AI supercycle if current demand trends persist.
The next earnings cycle will be the key trigger that determines whether TSMC continues its breakout trajectory or enters a longer consolidation phase within its powerful long-term uptrend.@Gate_Square @Gate广场_Official
repost-content-media
  • Reward
  • 6
  • Repost
  • Share
AngelEye:
1000x VIbes 🤑
View More
#TradeCFDWinGold #TradFi交易分享挑战 Eastern Time on May 29, 2026, Moderna (MRNA) trading volume was $301 million, an increase of 36.11% from yesterday, with a daily trading volume of 6.3184 million shares.
Moderna (MRNA) fell 0.8% on May 29, 2026, closing at $47.19, down 0.15% over the past 5 trading days, up 60.02% year-to-date, and down 18.36% over the past 60 days.
Moderna is a commercial-stage biotechnology company founded in 2010 and went public in December 2018. The company's mRNA technology was rapidly validated through its COVID-19 vaccine, which was approved in the United States in Decembe
post-image
post-image
post-image
Ryakpanda
#TradFi交易分享挑战 Eastern Time on May 29, 2026, Moderna (MRNA) trading volume was $301 million, an increase of 36.11% from yesterday, with a daily trading volume of 6.3184 million shares.
Moderna (MRNA) fell 0.8% on May 29, 2026, closing at $47.19, down 0.15% over the past 5 trading days, up 60.02% year-to-date, and down 18.36% over the past 60 days.
Moderna is a commercial-stage biotechnology company founded in 2010 and went public in December 2018. The company's mRNA technology was rapidly validated through its COVID-19 vaccine, which was approved in the United States in December 2020. As of August 2025, Moderna has 35 mRNA candidate drugs in clinical research, covering a wide range of therapeutic areas including infectious diseases, oncology, cardiovascular diseases, and rare genetic disorders.
Moderna (Moderna)'s mRNA technology outlook analysis:
1. Oncology treatment field
Core project mRNA-4157 (V940): A personalized tumor neoantigen vaccine developed in partnership with Merck, targeting indications such as melanoma and non-small cell lung cancer. Key Phase III clinical trial data are expected to be announced in 2026. If successful, it will become the first approved mRNA cancer vaccine, potentially opening a new paradigm for adjunct cancer therapy with huge market potential.
Pipeline expansion: In addition to melanoma, clinical research is underway for indications such as kidney cancer and bladder cancer. If the technology validation is successful, it could cover a broader range of cancer patients.
2. Respiratory vaccine field
Multivalent vaccine development: Developing flu/COVID combination vaccines (mRNA-1083), RSV vaccines, etc., aiming to cover seasonal respiratory diseases with a "one shot, multiple protections" strategy, potentially becoming an important competitor in the future respiratory vaccine market.
Technical advantages: The mRNA platform can be rapidly iterated to adapt to viral mutations, offering more flexibility and faster response compared to traditional vaccines.
3. Rare diseases and cardiovascular diseases
Rare disease treatment: Developing mRNA enzyme replacement therapies for rare diseases such as propionic acidemia and methylmalonic acidemia, with some projects already in Phase II trials. If successful, it will provide new treatment options for patients with rare diseases.
Cardiovascular diseases: Exploring the application of mRNA technology in treating cardiovascular conditions such as heart failure, for example, by encoding vascular endothelial growth factor (VEGF-A) to promote angiogenesis. Although in early stages, it has potential clinical value.
4. Technology platform and commercialization potential
Platform advantages: Moderna's mRNA platform includes core technologies such as chemical modifications and lipid nanoparticle (LNP) delivery systems, with large-scale production and rapid R&D capabilities, enabling quick responses to market demands.
Commercialization prospects: If tumor vaccines and respiratory vaccines are successfully launched, it is estimated that by 2030, the mRNA tumor vaccine market could exceed $8 billion, and the respiratory vaccine market will also become a stable revenue source.
Challenges and risks:
Uncertainty in clinical data: The results of Phase III trials for the tumor vaccine have not yet been announced, with a risk of failure.
Cost control: The production cost of personalized tumor vaccines is high; automation and scale-up are needed to reduce the cost per treatment course and improve market accessibility.
Policy and regulatory risks: Global vaccine policy fluctuations may impact market access and pricing, requiring adaptation to regulatory requirements in different regions.$MRNA
repost-content-media
  • Reward
  • 6
  • 1
  • Share
AngelEye:
1000x VIbes 🤑
View More
#StockTradingChallengeUpTo17000U 🚀 Top Doubling Player: Trade $1 to unlock 10x rewards!
Bounty order has been issued! Participate in the lottery to win double earning cards and share three major mainstream coin pools exclusively!
🎁 Easy two-step participation:
1️⃣ Guaranteed doubling card at start: Contract trading volume ≥ $1, with a chance to win a 10x card
2️⃣ Hold the card to share the prize pool: Enjoy multiplier bonuses and participate in up to three pools simultaneously
🔸 BTC Pool (0.5 BTC) ➔ Max per person 0.01 BTC
🔹 ETH Pool (10 ETH) ➔ Max per person 0.4 ETH
🔸 XRP Pool (10,000 XR
BTC1.11%
ETH1.24%
XRP2.8%
Gate广场_Official
🚀 Top Doubling Player: Trade $1 to unlock 10x rewards!
Bounty order has been issued! Participate in the lottery to win double earning cards and share three major mainstream coin pools exclusively!
🎁 Easy two-step participation:
1️⃣ Guaranteed doubling card at start: Contract trading volume ≥ $1, with a chance to win a 10x card
2️⃣ Hold the card to share the prize pool: Enjoy multiplier bonuses and participate in up to three pools simultaneously
🔸 BTC Pool (0.5 BTC) ➔ Max per person 0.01 BTC
🔹 ETH Pool (10 ETH) ➔ Max per person 0.4 ETH
🔸 XRP Pool (10,000 XRP) ➔ Max per person 150 XRP
🔗 Join now: https://gate.onelink.me/7pdk/90102049a79297bf
📜 Event announcement: https://www.gate.com/announcements/article/51439
repost-content-media
  • Reward
  • 1
  • Repost
  • Share
BeautifulDay:
To The Moon 🌕
#USIranNegotiationGame #$LAB
LAB/USDT Deep Market Analysis — Momentum, Structure, Psychology & Project Outlook
LAB has entered one of the most aggressive expansion phases seen in the current DeFi rotation cycle. The latest move above the mid-range consolidation zone pushed volatility sharply higher, while trading activity accelerated together with speculative participation. On the 4H structure, price expanded more than 31% within a short period and temporarily approached the upper volatility band, signaling strong short-term momentum but also elevated emotional trading conditions.
Current Mar
LAB35.64%
BTC1.02%
discovery
#$LAB
LAB/USDT Deep Market Analysis — Momentum, Structure, Psychology & Project Outlook
LAB has entered one of the most aggressive expansion phases seen in the current DeFi rotation cycle. The latest move above the mid-range consolidation zone pushed volatility sharply higher, while trading activity accelerated together with speculative participation. On the 4H structure, price expanded more than 31% within a short period and temporarily approached the upper volatility band, signaling strong short-term momentum but also elevated emotional trading conditions.
Current Market Structure
The chart shows a powerful impulsive breakout after a prolonged sideways compression phase between approximately 3.6 and 5.0 USDT. This type of structure usually indicates accumulation followed by liquidity expansion.
The most important observation is that price reclaimed the Bollinger mid-band and immediately accelerated toward the upper band. In strong momentum environments, this behavior often reflects aggressive buyer dominance and short liquidations rather than purely spot-driven demand.
At the moment, market participants appear divided into three groups:
Early buyers protecting profits
Momentum traders chasing continuation
Late entrants entering through emotional fear of missing out
That combination usually creates very sharp candles and unstable intraday swings.
Key Resistance Zones
First Resistance Area
5.90 — 6.15 USDT
This region is psychologically important because the current breakout candle is testing this zone aggressively. Sellers may attempt profit realization here.
Major Resistance Area
6.80 — 7.45 USDT
This is the strongest visible supply zone on the chart. The previous explosive wick toward 7.451 indicates heavy historical selling pressure and possible whale distribution activity.
If price reaches this region again with weakening volume, rejection probability rises significantly.
Key Support Zones
Immediate Support
5.20 — 5.35 USDT
Short-term momentum support. Remaining above this area preserves bullish control.
Structural Support
4.55 — 4.70 USDT
This aligns closely with the Bollinger middle band and previous consolidation range. A healthy correction could revisit this area without damaging the broader structure.
Critical Breakdown Zone
3.60 — 3.75 USDT
Loss of this region would severely weaken bullish structure and could trigger broader fear-driven selling pressure.
Volatility & Market Psychology
LAB currently reflects a classic high-beta speculative behavior pattern.
Several psychological stages are visible:
Compression Phase
Low attention, reduced volatility, silent accumulation.
Expansion Phase
Sudden volume growth attracts speculative capital.
Emotional Participation
Retail traders begin entering after large green candles appear.
Profit Rotation Risk
Early buyers may distribute positions into rising momentum.
The current stage appears to be between phases 3 and 4.
This is usually the period where volatility becomes extreme. Candle movements may become irrational temporarily due to leveraged positioning and aggressive sentiment swings.
Bollinger Band Analysis
The Bollinger Bands are expanding aggressively, which confirms volatility expansion.
Current structure suggests:
Upper band breakout momentum remains active
Mean reversion risk increases after vertical candles
Short-term overheating conditions may develop if volume weakens
When candles move too far away from the middle band without healthy consolidation, correction probability statistically rises.
Liquidity Behavior & Whale Activity
The chart structure suggests that liquidity sweeps are playing a major role.
Several long lower wicks indicate:
Stop-hunting behavior
Forced liquidations
Rapid absorption by larger participants
This kind of price action is common in smaller-cap high-volatility assets where liquidity depth remains limited.
Large players often exploit emotional entries by creating sharp upward expansions followed by rapid retracements.
DeFi Sector Context
LAB’s recent strength also aligns with broader renewed attention toward DeFi-related ecosystems and speculative infrastructure narratives.
Capital rotation inside crypto markets typically moves through phases:
Bitcoin dominance expansion
Large-cap altcoin recovery
Mid-cap speculative rotation
High-risk DeFi acceleration
LAB currently appears positioned inside the speculative rotation phase where traders seek higher volatility opportunities.
Risk Factors Investors Should Watch Carefully
Overextended Momentum
Parabolic candles rarely continue infinitely without consolidation.
Volume Sustainability
If price rises while volume declines, exhaustion risk increases.
Liquidation Cascades
Highly leveraged conditions can create sudden sharp reversals.
Whale Distribution
Large holders may use breakout excitement to exit positions gradually.
Emotional Trading
Fear-driven entries near resistance zones often create poor risk positioning.
What Strong Bulls Need To Maintain
For bullish continuation:
Price should remain above 5.20
Volume should remain elevated
Pullbacks should produce higher lows
Momentum candles should avoid immediate rejection
If these conditions remain valid, market structure can continue favoring upside continuation attempts toward higher resistance regions.
Professional Outlook
LAB currently shows one of the strongest short-term momentum structures among speculative DeFi-focused assets. However, the speed of the expansion also increases instability risk.
The most important factor now is whether buyers can transform this explosive breakout into sustainable higher-low structure instead of a temporary emotional spike.
Strong trends are built through:
Consolidation
Controlled pullbacks
Healthy volume continuation
Gradual market participation
If volatility becomes too aggressive without structural support formation, probability of sharp corrections rises significantly.
For disciplined investors, the coming sessions are likely more important than the breakout itself. Market behavior after excitement usually reveals whether the move represents genuine structural strength or temporary speculative overheating.
$LAB ‌
repost-content-media
  • Reward
  • 1
  • Repost
  • Share
BeautifulDay:
To The Moon 🌕
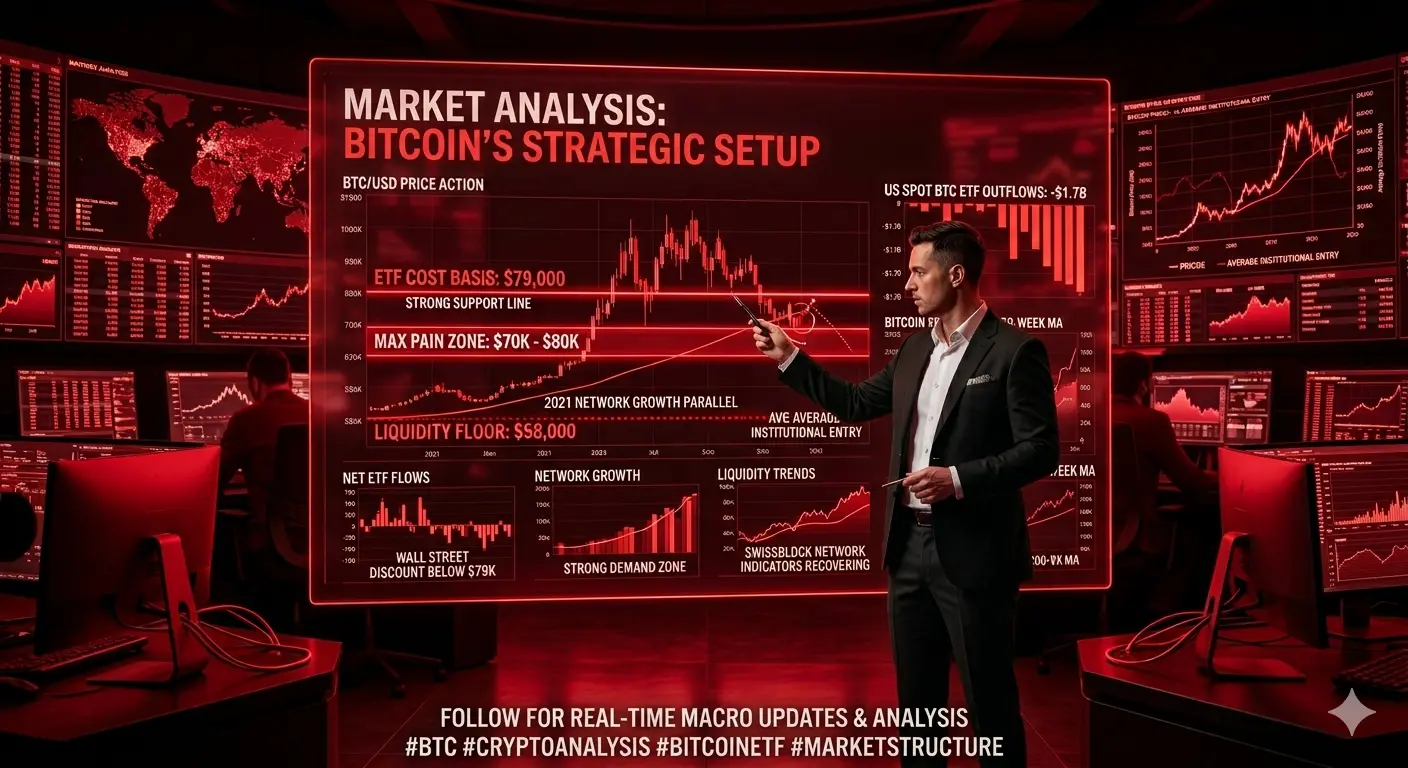
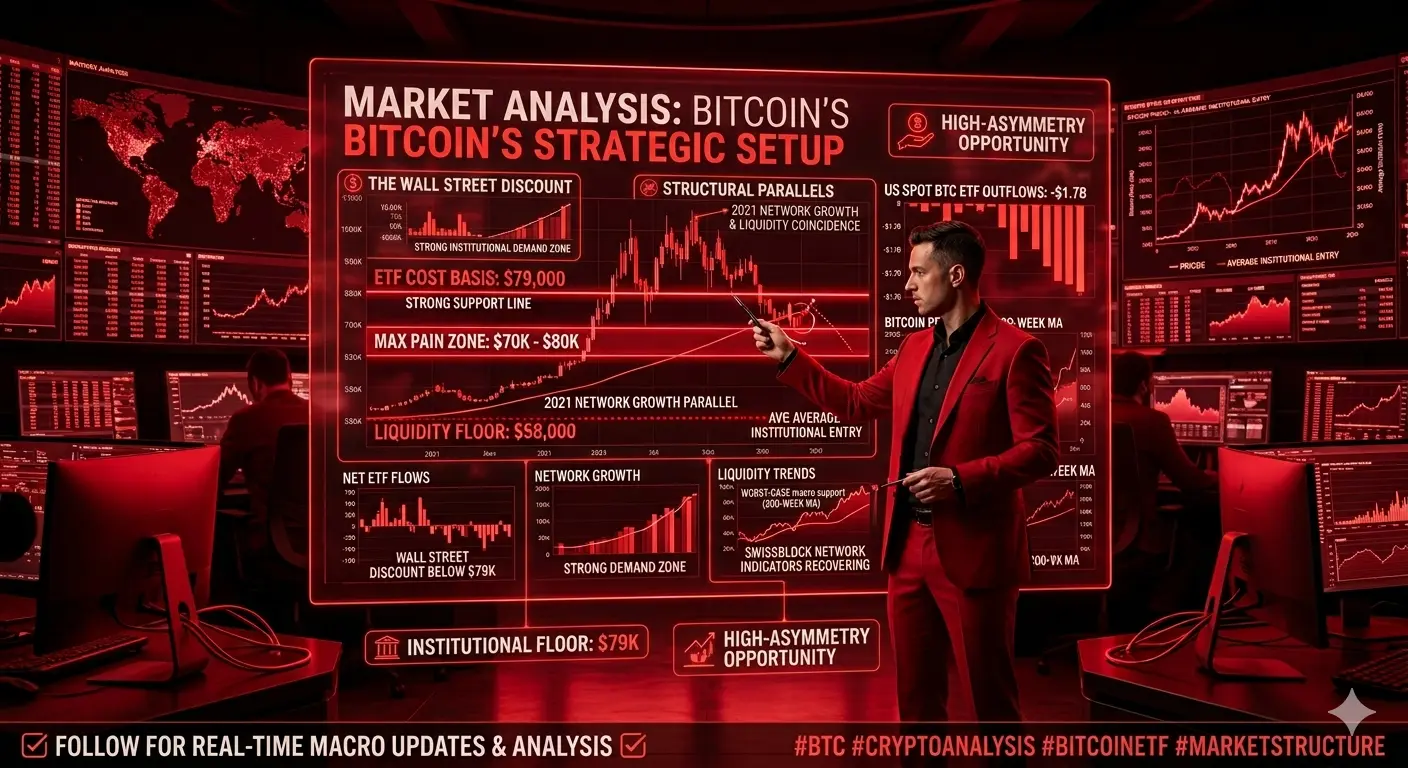
#StockTradingChallengeUpTo17000U 📊 Macro Analysis: Why Bitcoin’s Stay Below $80,000 May Be Short-Lived
If you have been watching the charts lately, market sentiment has undoubtedly felt heavy. A notable $1.7 billion in weekly outflows from crypto investment funds recently triggered a temporary shift, flipping year-to-date inflows into a net loss and driving the current bearish narrative.
However, a closer look at institutional data and historical structural frameworks suggests that the $70,000–$80,000 zone could act as a significant accumulation window rather than a permanent ceiling. Here is
BTC1.02%
post-image
post-image
post-image
  • Reward
  • Comment
  • Repost
  • Share
#WinGoldBarsWithGrowthPoints 📊 #TradFi交易分享挑战 | Deep Dive into 3M Company ($MMM)
3M Company ($MMM) is currently presenting a classic turnaround setup. While operational improvements are real—proven by recent earnings beats and margin progress—the stock price has yet to reward these gains due to short-term organic growth concerns and macroeconomic headwinds.
Here is a comprehensive breakdown of where $MMM stands and how to trade it.
📈 Market Snapshot (As of May 29, 2026)
Current Price: ~$153.13 (Intraday range: $151.94 – $154.41)
Market Cap: ~$79.9 Billion
P/E Ratio: ~29.5 | Dividend Yield: ~1
MMM0.18%
US5000.04%
WFC0.79%
MS1.71%
post-image
post-image
  • Reward
  • 5
  • Repost
  • Share
Ryakpanda:
Just charge forward 👊
View More
  • Reward
  • 1
  • Repost
  • Share
Ryakpanda:
Just charge forward 👊
#WTICrudeFallsBelow90Dollars #CBOEIntroducesExtendedTradingForStockOptions
📈 CBOE Extends Options Trading Hours — A New Era of 24H Market Volatility Begins
The SEC approving Cboe’s plan to extend trading hours for select stock options is a bigger shift than it might look at first glance. Starting July 13, traders will no longer be confined strictly to traditional market hours for some of the most actively traded U.S. equities.
We’re talking about names like Nvidia, Tesla, Apple, AMD, and Broadcom — basically the core of modern market volatility.
The structure is interesting:
Pre-market: 7:30
CBOE-3.09%
NVDA-0.68%
TSLA-1.47%
ABBV-0.22%
Crypto_Buzz_with_Alex
#CBOEIntroducesExtendedTradingForStockOptions
📈 CBOE Extends Options Trading Hours — A New Era of 24H Market Volatility Begins
The SEC approving Cboe’s plan to extend trading hours for select stock options is a bigger shift than it might look at first glance. Starting July 13, traders will no longer be confined strictly to traditional market hours for some of the most actively traded U.S. equities.
We’re talking about names like Nvidia, Tesla, Apple, AMD, and Broadcom — basically the core of modern market volatility.
The structure is interesting:
Pre-market: 7:30–9:25 ET
Post-market: 16:00–16:15 ET
And while the time windows look short at first, the psychological impact is much bigger — it opens the door for near-continuous options pricing pressure across global sessions.
From a trader’s perspective, this changes behavior more than mechanics. Earnings reactions, macro data releases, and geopolitical headlines will now have more immediate derivatives pricing impact, instead of waiting for the next session open.
That means volatility won’t just be higher — it will be more fragmented. Liquidity spikes, thinner order books, and sharper intraday dislocations are all likely outcomes, especially in the early rollout phase.
Personally, I see this as a double-edged opportunity. On one hand, it allows better risk management around events like earnings without holding overnight blind exposure. On the other hand, it increases the complexity of execution — especially for retail traders who aren’t used to reacting outside standard market hours.
The bigger picture here is clear: traditional market structure is slowly moving toward near-24/5 derivatives trading, aligning more with crypto-style continuous markets.
The question is whether traders are ready for it — because the market is definitely moving in that direction whether we are prepared or not.
How do you see this affecting your strategy — more control over risk, or more stress from constant market pressure?
#CBOE #OptionsTrading #GateSquare
repost-content-media
  • Reward
  • 1
  • Repost
  • Share
HighAmbition:
good 👍 good 👍 good
#WinGoldBarsWithGrowthPoints 🏎️ Red Bull Trading Tour - Phase Four Now Open
Trade to climb the leaderboard and share a prize pool of 60,000 GT! Win F1 race tickets
Complete various tasks with no threshold to receive GT airdrops!
VIP users get special acceleration, complete upgrades to receive high-value mileage!
Join now, accelerate to victory!
👉 https://www.gate.com/competition/f1rb/s9
GT0.29%
Gate广场_Official
🏎️ Red Bull Trading Tour - Phase Four Now Open
Trade to climb the leaderboard and share a prize pool of 60,000 GT! Win F1 race tickets
Complete various tasks with no threshold to receive GT airdrops!
VIP users get special acceleration, complete upgrades to receive high-value mileage!
Join now, accelerate to victory!
👉 https://www.gate.com/competition/f1rb/s9
repost-content-media
  • Reward
  • 1
  • Repost
  • Share
HighAmbition:
2026 GOGOGO 👊
  • Reward
  • Comment
  • Repost
  • Share
#24hCryptoFuturesLiquidationsTop400M #TradFi交易分享挑战
#MU
Micron Technology (MU) Stock Analysis:
Stands at the very center of the global AI supercycle, evolving into a strategic backbone of next-generation computing infrastructure, where memory performance, bandwidth, and efficiency define the speed of artificial intelligence itself
is no longer viewed as a traditional cyclical chip maker. It is now positioned as a core AI enabler, benefiting directly from explosive demand for HBM (High Bandwidth Memory), advanced DRAM, and hyperscale data center storage systems powering AI training and infere
MU4.12%
post-image
post-image
HighAmbition
#TradFi交易分享挑战
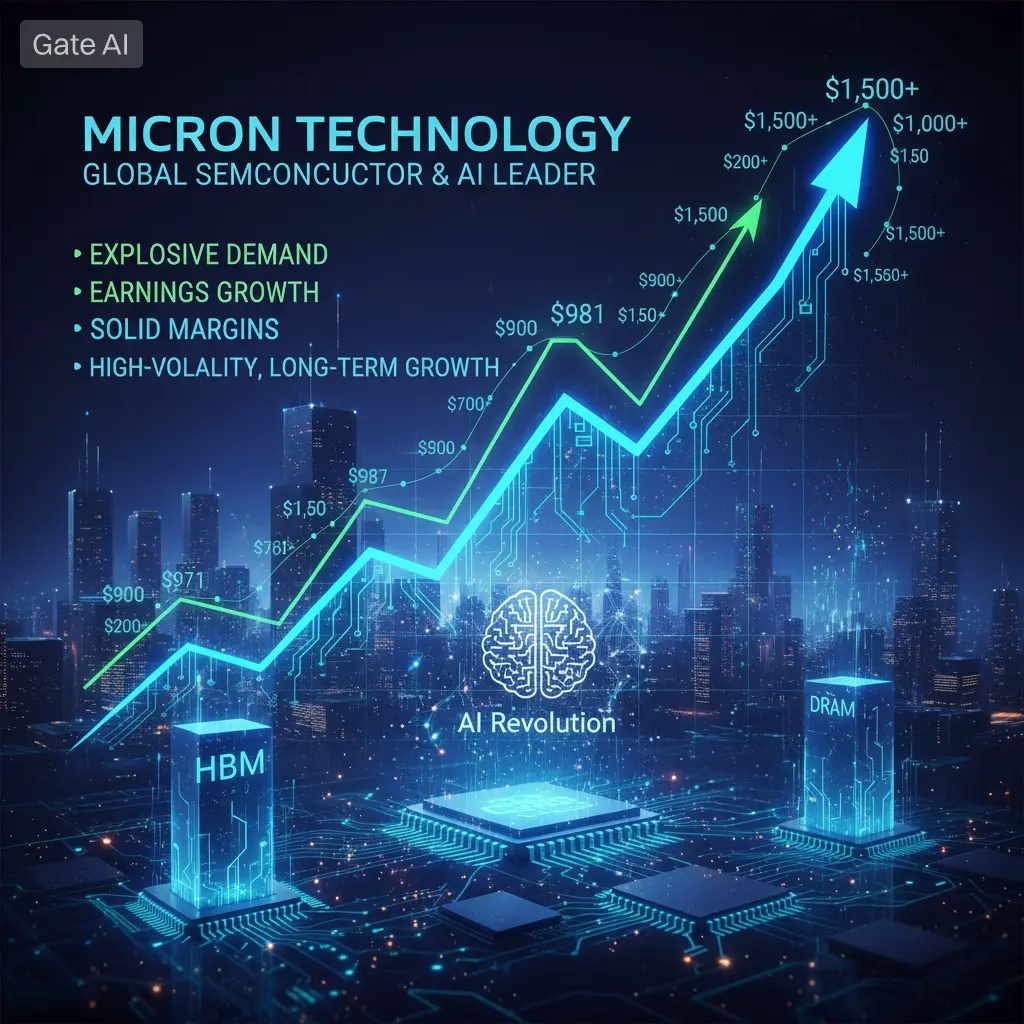
#MU
Micron Technology (MU) Stock Analysis:
Stands at the very center of the global AI supercycle, evolving into a strategic backbone of next-generation computing infrastructure, where memory performance, bandwidth, and efficiency define the speed of artificial intelligence itself
is no longer viewed as a traditional cyclical chip maker. It is now positioned as a core AI enabler, benefiting directly from explosive demand for HBM (High Bandwidth Memory), advanced DRAM, and hyperscale data center storage systems powering AI training and inference workloads
The stock trades near $971, after recently printing highs around $981, confirming strong institutional momentum and continued AI-driven revaluation across semiconductor equities
From a broader perspective, MU has delivered a historic rally — climbing from approximately $94–$100 levels to nearly $1,000, representing a massive 900%+ surge, driven by structural AI demand, supply shortages, and aggressive hyperscaler expansion
Price action remains highly active in the $940–$981 range, reflecting strong bullish structure but also short-term profit-taking after an extreme vertical expansion phase
Financial Performance: A Structural Re-Rating Phase
Micron’s financial transformation is now clearly in a new earnings regime, where AI demand has shifted the company into a higher profitability cycle.
Revenue: ~$23.86B (+200% YoY explosion)
EPS: ~$12.20 (strong upside surprise)
Gross Margin: ~75% (premium semiconductor profitability level)
Forward Revenue: ~$33.5B projected expansion path
Forward EPS: ~$19.15 expected continuation strength
This is not a normal semiconductor recovery cycle — this is a structural AI demand supercycle with pricing power expansion and supply constraints simultaneously in play
Even after a massive rally, valuation remains relatively grounded at ~9–11x forward earnings, suggesting that the market still has not fully priced extreme long-term AI upside scenarios
Analyst Forecast: Extreme Divergence Reflecting Uncertainty
Wall Street expectations for MU remain widely dispersed — a classic signature of transition-phase mega-cycle equities.
Bear case: $250 – $400 (cycle normalization risk)
Base institutional range: $595 – $804
Current market price: ~$971
Consensus bullish band: $900 – $1,100
Aggressive bull targets: $1,200 – $1,750+
Ultra-optimistic long-term models extend beyond $2,000–$3,000+, assuming persistent AI demand expansion, prolonged HBM shortages, and sustained hyperscaler capital spending through 2030
The wide dispersion signals one key truth:
👉 The market has not yet decided whether MU is a cyclical rebound story or a long-term AI compounder.
Technical Structure: Strong Trend, Extended Phase
MU remains in a powerful bullish structure, but after a near-vertical move, price behavior reflects controlled consolidation and volatility expansion
Key Support Zones:
$940 – immediate institutional demand floor
$900 – psychological + structural defense zone
$850 – major accumulation region
$800 – deep value re-entry zone
Key Resistance Zones:
$981 – recent all-time high
$1,000 – critical breakout trigger
$1,100 – momentum extension level
$1,200 – trend continuation confirmation
The structure continues to print higher highs and higher lows, but momentum is transitioning from explosive expansion to controlled consolidation
Institutional Flow & Market Psychology
Institutional participation remains exceptionally strong, with trading volumes consistently exceeding 60 million shares per session, significantly above long-term averages
This confirms that MU is not a speculative retail-driven move — it is part of a global AI capital rotation led by institutional funds, hedge funds, and semiconductor allocation strategies.
Market positioning is driven by:
Massive AI data center expansion cycles
Persistent HBM supply shortages
GPU memory bottlenecks
Cloud hyperscaler infrastructure scaling
is increasingly being classified as a strategic AI infrastructure equity, sitting alongside top-tier semiconductor leaders in global portfolios
Trading Strategy: Momentum with Structured Risk Control
Short-Term Setup:
Entry zone: $940–$960 pullback region
Breakout trigger: $980–$1,000 confirmation
Upside target: $1,050–$1,100 momentum extension
Risk control: below $900 invalidation zone
Swing Trading Setup:
Core support: $850–$900 accumulation band
Trend remains bullish above $900 level
Long-Term Positioning:
Strategic accumulation zone: $800–$850 dips
Thesis: multi-year AI memory supercycle expansion
Key Growth Catalysts
The structural upside drivers remain powerful and long-lasting:
Global AI infrastructure buildout acceleration
Severe and persistent HBM supply shortages
Strong DRAM pricing recovery cycle
Hyperscaler spending surge (Amazon, Microsoft, Google)
Tight semiconductor supply discipline globally
This represents a demand shock + supply constraint environment, historically one of the strongest setups for semiconductor expansion cycles
Risk Factors: Why Volatility Will Stay Elevated
Despite strong momentum, MU remains exposed to sharp corrections:
Semiconductor cycle normalization risk
AI capital spending slowdown risk
Geopolitical supply chain disruption
Rapid valuation expansion correction pressure
Enterprise inventory cycle adjustments
MU remains a high-beta AI equity, meaning volatility is structural, not temporary
Catalyst Watch: Earnings Event (June 24, 2026)
Upcoming earnings remain the most critical near-term trigger
Possible Scenarios:
Strong beat + bullish guidance → $1,100–$1,200 breakout
Neutral outcome → consolidation near $900–$1,000
Weak guidance → correction toward $800–$850
Volatility is expected to spike significantly around this event due to elevated expectations.
Scenario-Based Outlook
Conservative Scenario:
Retracement toward $800–$750 zone if AI momentum cools or macro conditions weaken.
Base Scenario:
Range consolidation between $900–$1,100, maintaining structural bullish trend
Bullish Scenario:
Expansion toward $1,200–$1,500+, driven by continued AI infrastructure acceleration.
has transitioned into one of the most important structural beneficiaries of the AI revolution, with its surge toward $971–$981 reflecting a full-scale revaluation of memory chips as strategic AI assets
The stock’s extraordinary 900%+ rally marks one of the most powerful semiconductor expansions in recent market history, driven by AI demand shock, pricing power, and supply constraints
However, MU now sits at a critical inflection point where momentum remains strong, but volatility is elevated and the next directional move will depend entirely on earnings and AI demand sustainability
The coming cycle will decide whether MU continues toward $1,200–$1,500+, or enters a consolidation phase after a historic rally that redefined the semiconductor landscape.
repost-content-media
  • Reward
  • 2
  • Repost
  • Share
HighAmbition:
To The Moon 🌕
View More
#MicronMarketCapBreaks1Trillion 🌈 Gate Live Streaming Inspiration - May 30
Popular Topic Recommendations:
🔹 Bitcoin mining difficulty increases by 1.72% to 138.96 T
🔹 Iranian Foreign Ministry: Currently focused on ending the war, no negotiations on nuclear plans
🔹 Early investors in HYPE are starting to take profits, with total gains exceeding $94 million
🔹 The United States' first regulated Bitcoin perpetual contract approved, Kalshi to launch BTCPERP
🔹 U.S. SEC Chairman: Working with CFTC to advance Project Crypto, supporting the U.S. becoming a global crypto hub
🔹 U.S.
BTC1.11%
HYPE8.1%
KALSHI2.16%
US5000.04%
GateLiveChinese
🌈 Gate Live Streaming Inspiration - May 30
Popular Topic Recommendations:
🔹 Bitcoin mining difficulty increases by 1.72% to 138.96 T
🔹 Iranian Foreign Ministry: Currently focused on ending the war, no negotiations on nuclear plans
🔹 Early investors in HYPE are starting to take profits, with total gains exceeding $94 million
🔹 The United States' first regulated Bitcoin perpetual contract approved, Kalshi to launch BTCPERP
🔹 U.S. SEC Chairman: Working with CFTC to advance Project Crypto, supporting the U.S. becoming a global crypto hub
🔹 U.S. stock market closes with slight gains across the three major indices, S&P 500 up for nine consecutive weeks, PURR up nearly 17%
🔹 U.S. Treasury Secretary: The U.S. has seized approximately $1 billion in crypto assets from Iran
🔹 Suspected Bitmine address increases holdings by 25k ETH again, worth about $50.56 million
Choose any topic to start streaming and have a chance to be featured on the homepage! 🔥 More topic ideas and tips: https://www.gate.com/help/community-center/live_chat/49345
repost-content-media
  • Reward
  • 3
  • Repost
  • Share
HighAmbition:
good information 👍👍👍👍👍 good
View More
#AnthropicValuationHits965BillionDollars 📊 TradFi Trading Insights: Is Moderna ($MRNA) a Sleeping Giant or a Cash Burn Trap?
Moderna ($MRNA) is at a fascinating crossroads. After generating over $18B annually during the COVID-19 vaccine boom, the company is executing a massive pivot into a diversified biotechnology platform focused on oncology, influenza, RSV, rare diseases, and next-gen vaccines.
Here is a comprehensive breakdown of MRNA’s financial health, technical setup, and potential trade structures as we move through 2026.
📈 Financial & Fundamental Health (Q1 2026)
While profitability
MRNA-0.14%
post-image
  • Reward
  • 1
  • Repost
  • Share
HighAmbition:
To The Moon 🌕
#CBOEIntroducesExtendedTradingForStockOptions #24hCryptoFuturesLiquidationsTop400M
24h Crypto Futures Liquidations Top 400M as Leverage Pressure Resets Market Momentum
The cryptocurrency market has once again experienced a sharp volatility shock as total futures liquidations over the past 24 hours exceeded 400 million dollars, signaling a rapid and aggressive reset in leveraged trading positions across major digital assets. This sudden liquidation event highlights the extreme sensitivity of crypto derivatives markets to price swings, liquidity imbalances, and cascading margin calls that often
BTC1.11%
ETH1.24%
ShainingMoon
#24hCryptoFuturesLiquidationsTop400M
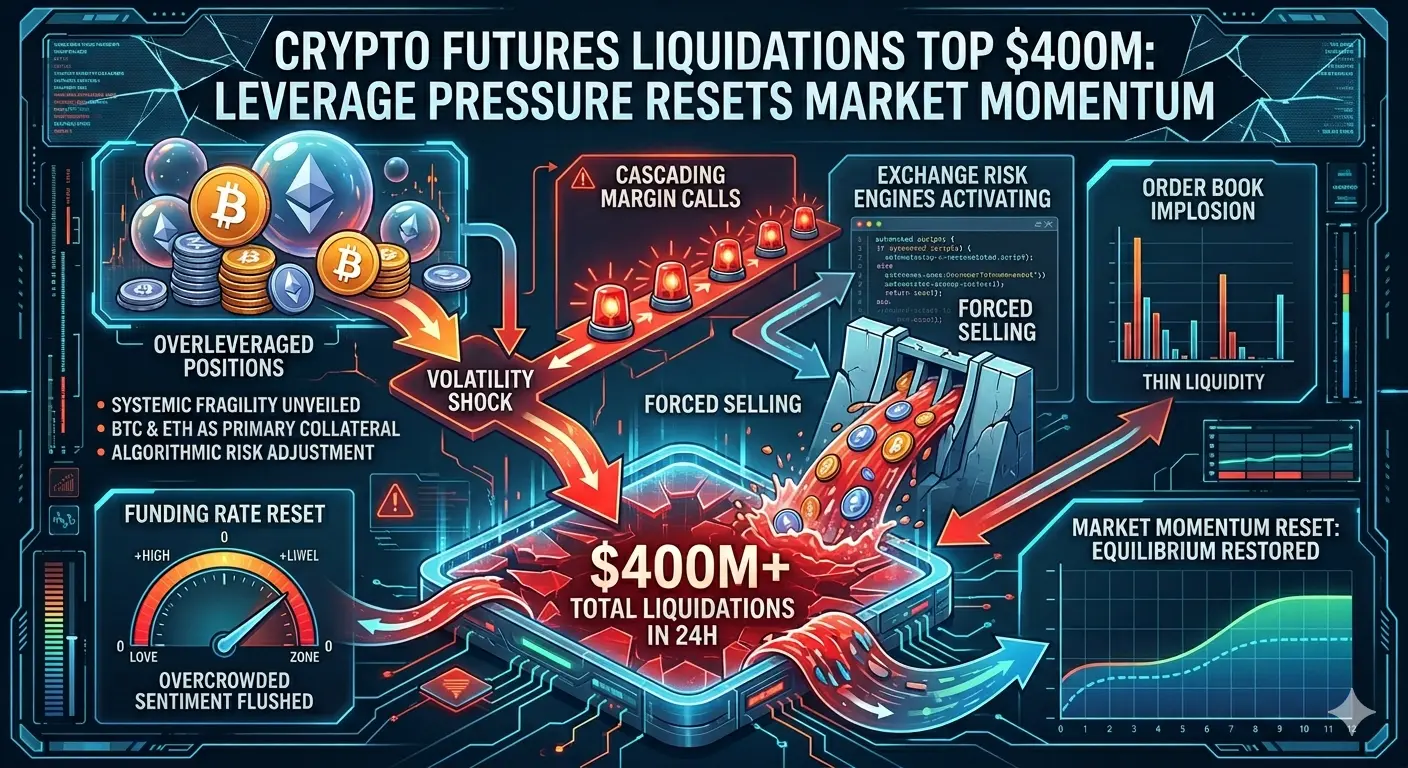
24h Crypto Futures Liquidations Top 400M as Leverage Pressure Resets Market Momentum
The cryptocurrency market has once again experienced a sharp volatility shock as total futures liquidations over the past 24 hours exceeded 400 million dollars, signaling a rapid and aggressive reset in leveraged trading positions across major digital assets. This sudden liquidation event highlights the extreme sensitivity of crypto derivatives markets to price swings, liquidity imbalances, and cascading margin calls that often intensify during periods of heightened volatility.
Crypto futures trading has become one of the most dominant forces shaping short-term price action in Bitcoin, Ethereum, and major altcoins. Unlike spot markets, futures allow traders to use leverage, amplifying both potential gains and losses. While leverage increases market efficiency and liquidity during stable conditions, it also creates systemic fragility during sharp directional moves.
The recent liquidation spike reflects a rapid unwinding of overleveraged positions. As prices moved sharply against highly leveraged traders, exchanges automatically closed positions to prevent further losses, triggering a chain reaction of forced selling. This cascading effect often accelerates downward momentum, creating sudden price drops that appear disconnected from broader fundamental trends.
One of the key characteristics of crypto futures markets is the dominance of leverage-driven sentiment. When bullish positioning becomes excessive, even a moderate price correction can trigger large-scale liquidations. Similarly, during bearish overcrowding, upward moves can cause short squeezes that rapidly push prices higher. This constant imbalance between longs and shorts creates a highly reactive market structure.
The 400 million dollar liquidation figure underscores how large the derivatives ecosystem has become. In previous market cycles, such numbers were considered extreme. Today, they are increasingly common as institutional participation, retail leverage trading, and global access to derivatives platforms continue to expand.
Bitcoin and Ethereum typically account for the majority of liquidation volume during such events. These assets serve as the primary collateral base for the broader crypto derivatives ecosystem. When volatility spikes in these major assets, it often triggers cross-market reactions affecting altcoins, decentralized finance tokens, and correlated digital instruments.
Market structure plays a crucial role in understanding liquidation events. Many traders use cross-margin or isolated-margin leverage systems, which can amplify systemic risk during rapid price movements. When multiple positions are liquidated simultaneously, exchange order books can become thin, leading to exaggerated price movements in short timeframes.
Another important factor contributing to liquidation cascades is the presence of algorithmic trading systems and automated risk engines. These systems continuously adjust exposure based on volatility, funding rates, and market depth. When conditions deteriorate quickly, algorithms often reduce risk exposure simultaneously, further intensifying market pressure.
Funding rates in perpetual futures markets also influence trader positioning. When funding becomes heavily skewed in one direction, it indicates overcrowded sentiment. In many cases, liquidation events act as a natural reset mechanism, bringing funding rates back toward neutral levels and restoring market balance.
The psychological impact of liquidation events is equally important. Sudden losses can trigger panic selling among retail traders, while institutional participants often use volatility spikes as opportunities to re-enter positions at more favorable levels. This contrast between fear-driven exits and strategic accumulation creates complex market dynamics.
Despite short-term disruption, liquidation events are a normal part of crypto market structure. They serve as mechanisms that reduce excessive leverage and restore liquidity equilibrium. Without periodic resets, markets would become increasingly unstable due to unchecked leverage accumulation.
From a macro perspective, crypto futures markets are increasingly influenced by global liquidity conditions, interest rate expectations, and risk sentiment across traditional financial systems. When macro uncertainty rises, leveraged assets such as cryptocurrencies often experience higher volatility and more frequent liquidation events.
Exchange infrastructure also plays a critical role in managing liquidation events. Modern trading platforms rely on advanced risk engines designed to execute liquidations efficiently while minimizing systemic disruption. However, during extreme volatility, even advanced systems can struggle to maintain orderly execution conditions.
One notable trend in recent years is the increasing participation of institutional traders in crypto derivatives markets. Hedge funds, proprietary trading firms, and asset managers now actively use futures contracts for hedging and speculative strategies. This institutional presence has increased market depth but has also contributed to larger aggregate liquidation volumes.
Cross-exchange dynamics further amplify liquidation behavior. When multiple exchanges experience simultaneous volatility, arbitrage mechanisms and price discrepancies can accelerate trading activity across platforms, contributing to synchronized liquidation waves.
Stablecoin liquidity also influences futures market stability. As stablecoin reserves and liquidity pools expand, they provide additional capital buffers for leveraged trading. However, during extreme stress events, liquidity can still contract rapidly, intensifying price dislocations.
The current 24-hour liquidation event serves as a reminder of the dual nature of crypto derivatives markets. While they offer significant opportunities for profit through leverage and volatility, they also carry heightened systemic risk due to their interconnected structure and rapid feedback loops.
For traders, managing risk becomes essential in such environments. Position sizing, stop-loss discipline, leverage control, and portfolio diversification are critical tools for surviving volatile conditions. Professional traders often emphasize capital preservation over aggressive exposure during uncertain market phases.
From a market perspective, liquidation events often create potential turning points. Once excessive leverage is flushed out, markets can stabilize and establish new directional trends. These reset phases are closely watched by analysts for identifying potential accumulation zones or trend reversals.
The broader crypto ecosystem continues to evolve rapidly, with futures markets playing an increasingly central role in price discovery. As infrastructure matures and participation expands, liquidation events may become more structured, but their fundamental nature as volatility amplifiers is unlikely to disappear.
Ultimately, the 24-hour crypto futures liquidation surpassing 400 million dollars reflects the ongoing tension between opportunity and risk in leveraged digital asset markets. It highlights both the power and fragility of modern crypto trading systems, where rapid price movements can reshape sentiment, reposition capital, and redefine short-term market direction within hours.
repost-content-media
  • Reward
  • 1
  • Repost
  • Share
HighAmbition:
To The Moon 🌕
  • Reward
  • 4
  • Repost
  • Share
ybaser:
To The Moon 🌕
View More
  • Reward
  • 2
  • Repost
  • Share
HighAmbition:
To The Moon 🌕
View More
  • Reward
  • 2
  • Repost
  • Share
HighAmbition:
To The Moon 🌕
View More
  • Pinned