ShengdongTrendTheory
現在、コンテンツはありません
ShengdongTrendTheory
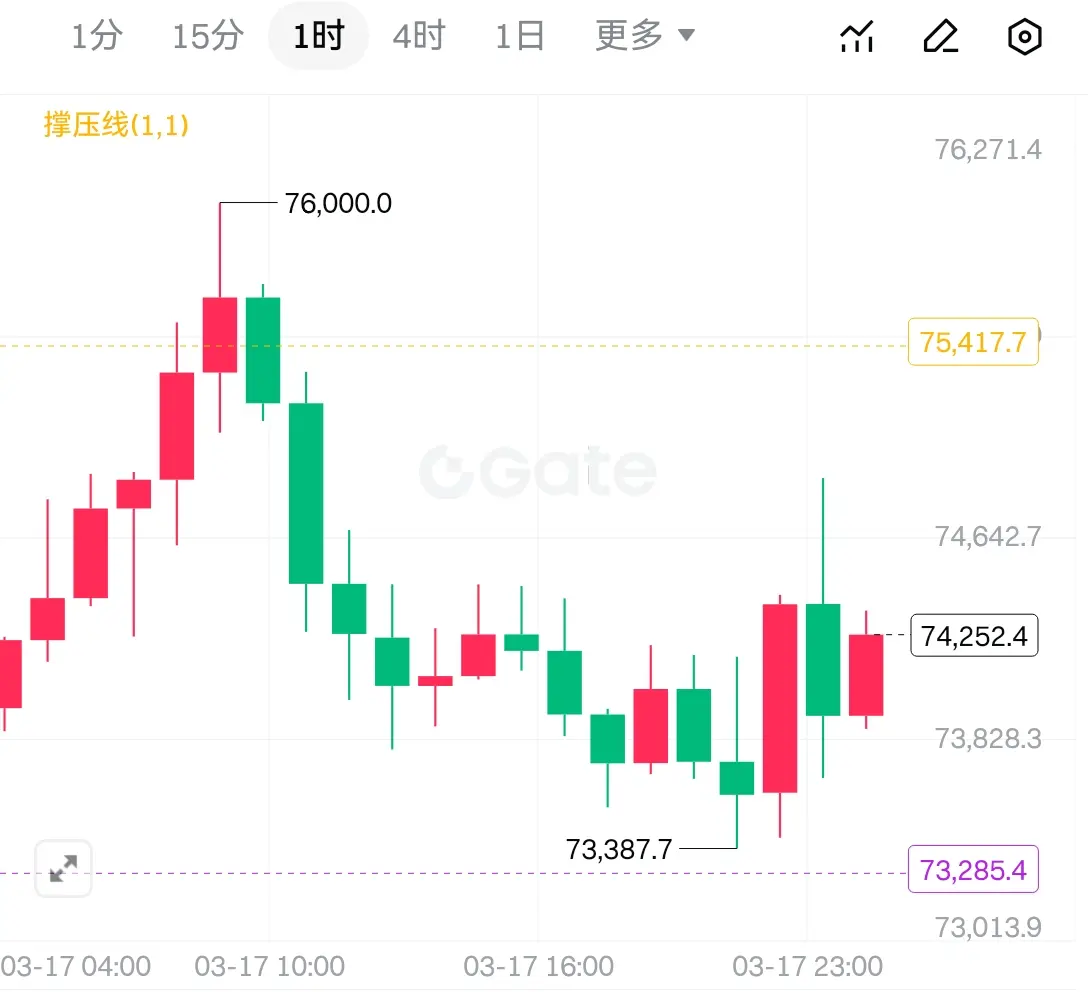
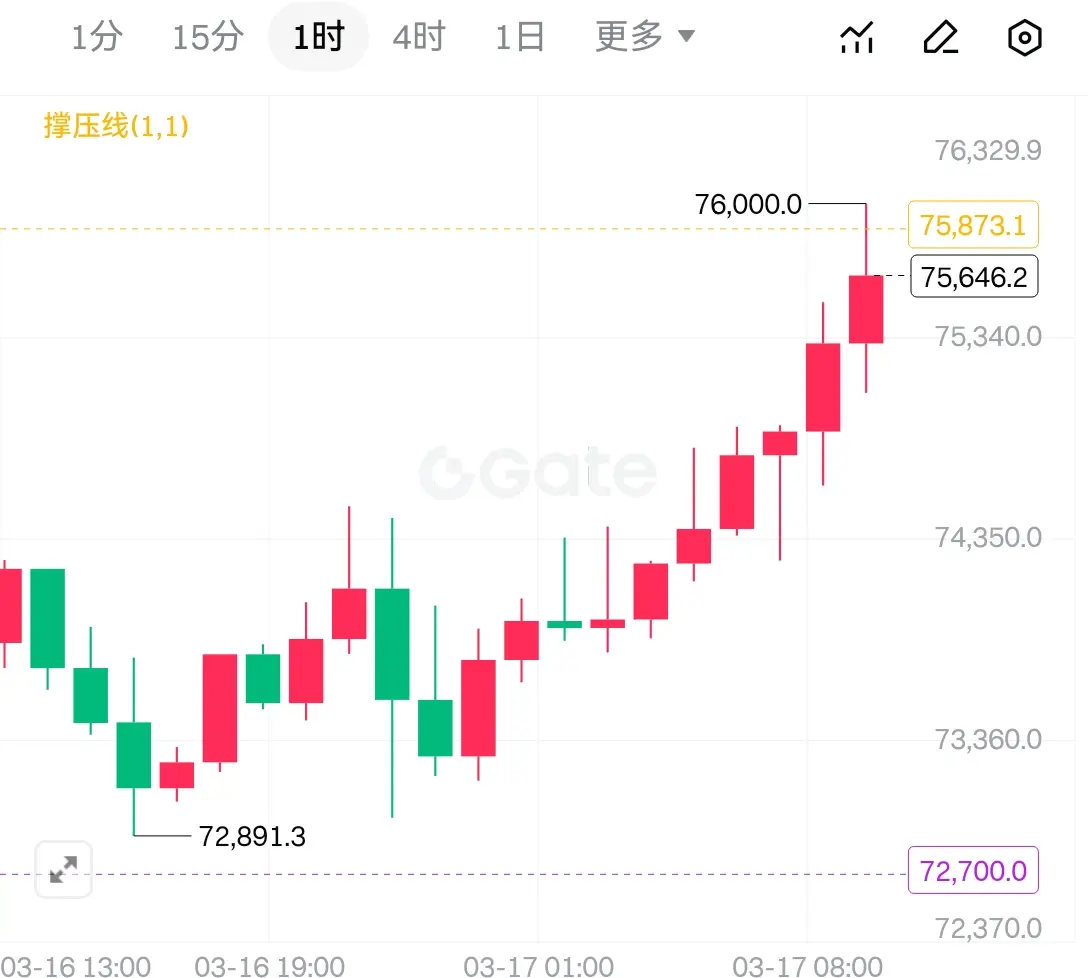
$BTC 3.18凌晨のビットコイン・イーサリアム相場分析と取引アドバイス
現状の構造から見ると、価格は重要な買いと売りの分水嶺エリアでパニック売りを起こさず、むしろ反復的に震荡整理を選択しており、これは強気のシグナルです。特に4時間足では、早朝に一波の上昇後の下落を見せ、長い上ヒゲを残しており、テクニカルな形状から短期的な天井の錯覚を与えることがあります。
現在のところ、市場は早朝の下落トレンドを止めて、震荡しながら上昇に転じています。次に注目すべきポイントは非常に明確で、現在の価格が以前の重要な抵抗ラインをしっかりと支えられるかどうかです。この動きがスムーズに実現すれば、「抵抗が支持に変わる」トップとボトムの転換が正式に確立され、次の反発や反転の余地が生まれます。
したがって、深夜の取引戦略としても、引き続き低買いを中心とした方針を維持できます。下の強い支持エリアが有効に割り込まれるまでは、震荡による恐怖に慌てる必要はありません。待ちに待った押し目買いのチャンスを、忍耐強く待つことが深夜時間帯ではより堅実な選択肢となるでしょう。
BTC0.67%
- 報酬
- いいね
- コメント
- リポスト
- 共有
$BTC From the current chart structure, the market is in a normal consolidation phase after a breakout, which is by no means a signal of trend reversal. We must maintain a clear understanding: financial markets have never had the myth of only rising without falling, nor will there be a dead end of only falling without rising. Therefore, this phase of pullback is not only not scary, but rather the healthiest "correction step" in a trending move. It clears floating chips for subsequent upside attacks and lays a more solid foundation.
Currently, this wave of pullback has not completely exhausted
Currently, this wave of pullback has not completely exhausted
BTC0.67%
- 報酬
- 2
- コメント
- リポスト
- 共有
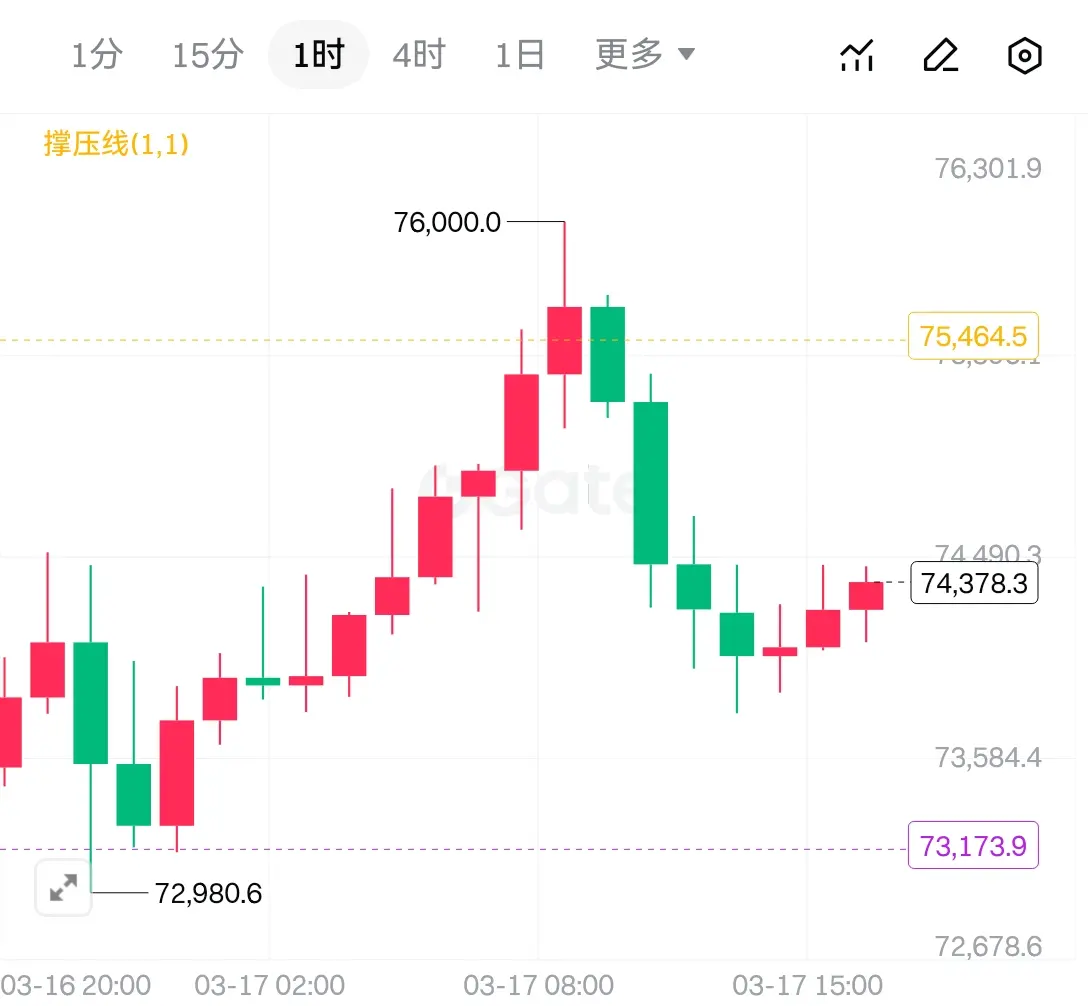
$BTC 3.17 Afternoon Bitcoin and Ethereum Market Analysis and Trading Recommendations
From the current market structure, the market has entered a strong controlling pattern. On the 4-hour level, the coin price has consistently relied on the upper band of the Bollinger Bands, presenting a steady upward oscillation posture. Although the market is not a one-sided violent rally, this "two steps forward, one step back" slow bull trend often indicates more sustainable momentum. It is worth noting that despite the large volatility base, each rally is accompanied by certain pullbacks to wash out float
From the current market structure, the market has entered a strong controlling pattern. On the 4-hour level, the coin price has consistently relied on the upper band of the Bollinger Bands, presenting a steady upward oscillation posture. Although the market is not a one-sided violent rally, this "two steps forward, one step back" slow bull trend often indicates more sustainable momentum. It is worth noting that despite the large volatility base, each rally is accompanied by certain pullbacks to wash out float
BTC0.67%
- 報酬
- 1
- コメント
- リポスト
- 共有
$BTC 1. Daily timeframe remains strong: On the daily K-line chart, the coin price shows a continuous pattern of rising with bullish candles, and each bullish candle has a full body, demonstrating the persistence and determination of buying power. This textbook-style consecutive bullish formation is the strongest signal of bulls controlling the market, accumulating sufficient momentum for the subsequent second push higher.
2. Smaller timeframes establish solid support: On smaller timeframes such as hourly charts, price is consolidating strongly at higher levels, with the core purpose being to
2. Smaller timeframes establish solid support: On smaller timeframes such as hourly charts, price is consolidating strongly at higher levels, with the core purpose being to
BTC0.67%
- 報酬
- いいね
- コメント
- リポスト
- 共有
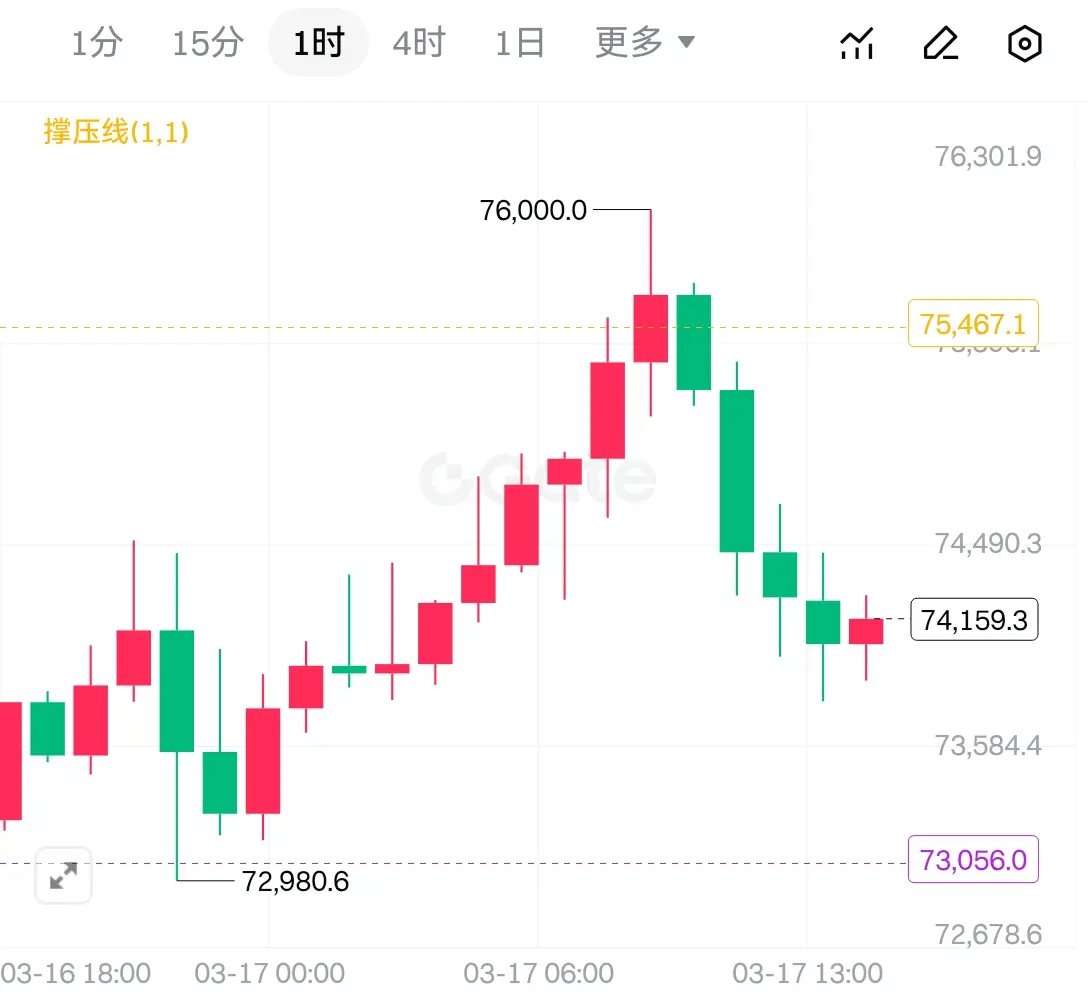
$BTC 3.17 Midday Bitcoin and Ethereum Market Analysis and Trading Recommendations
From the current chart structure, the daily level has already closed nine consecutive bullish candles, which is an extremely rare bullish signal! This is not only a manifestation of bullish strength, but also an effective breakout from the previous consolidation range. As the coin price continues to rise, the moving average system (MA5/10) at the daily level has formed a golden cross diverging upward, and the Bollinger Bands channel is also expanding synchronously with the price rally. This technical pattern ind
From the current chart structure, the daily level has already closed nine consecutive bullish candles, which is an extremely rare bullish signal! This is not only a manifestation of bullish strength, but also an effective breakout from the previous consolidation range. As the coin price continues to rise, the moving average system (MA5/10) at the daily level has formed a golden cross diverging upward, and the Bollinger Bands channel is also expanding synchronously with the price rally. This technical pattern ind
BTC0.67%
- 報酬
- いいね
- コメント
- リポスト
- 共有
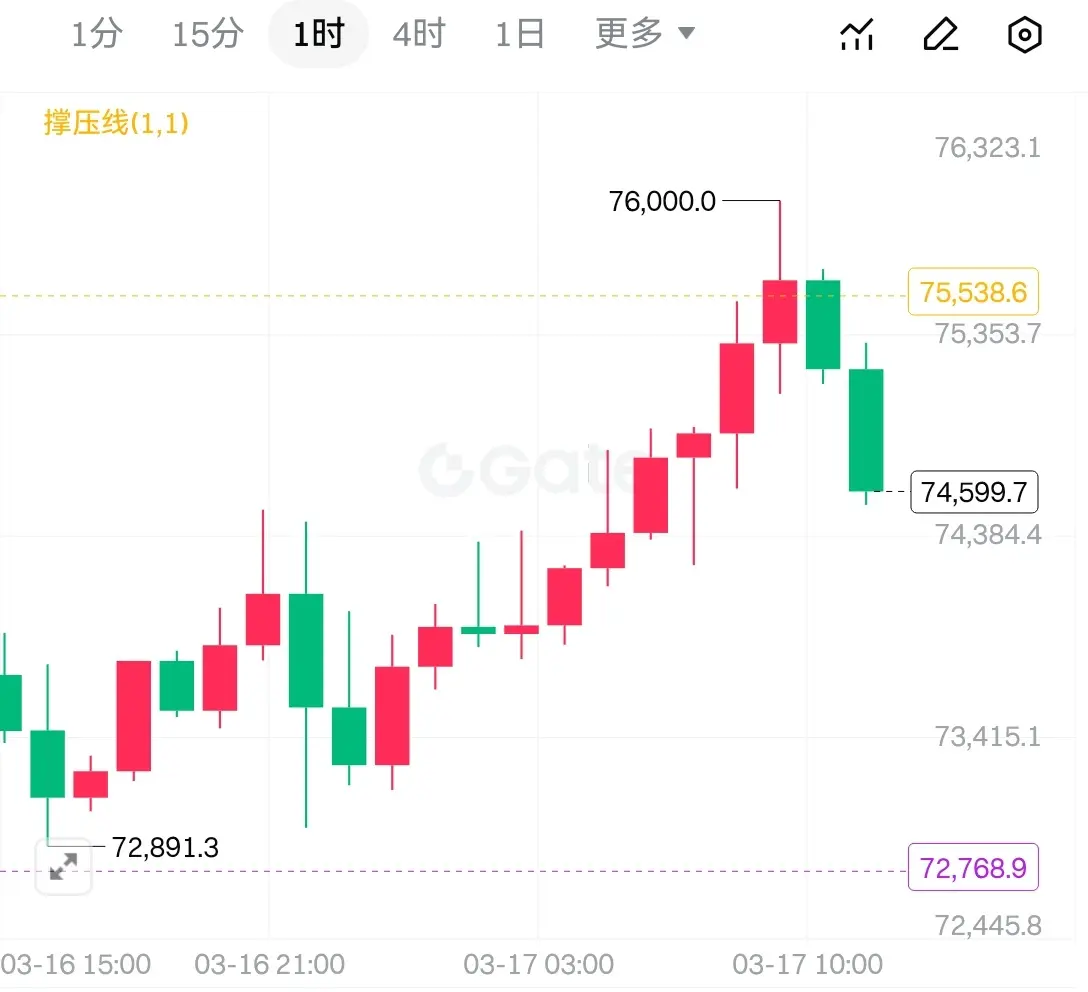
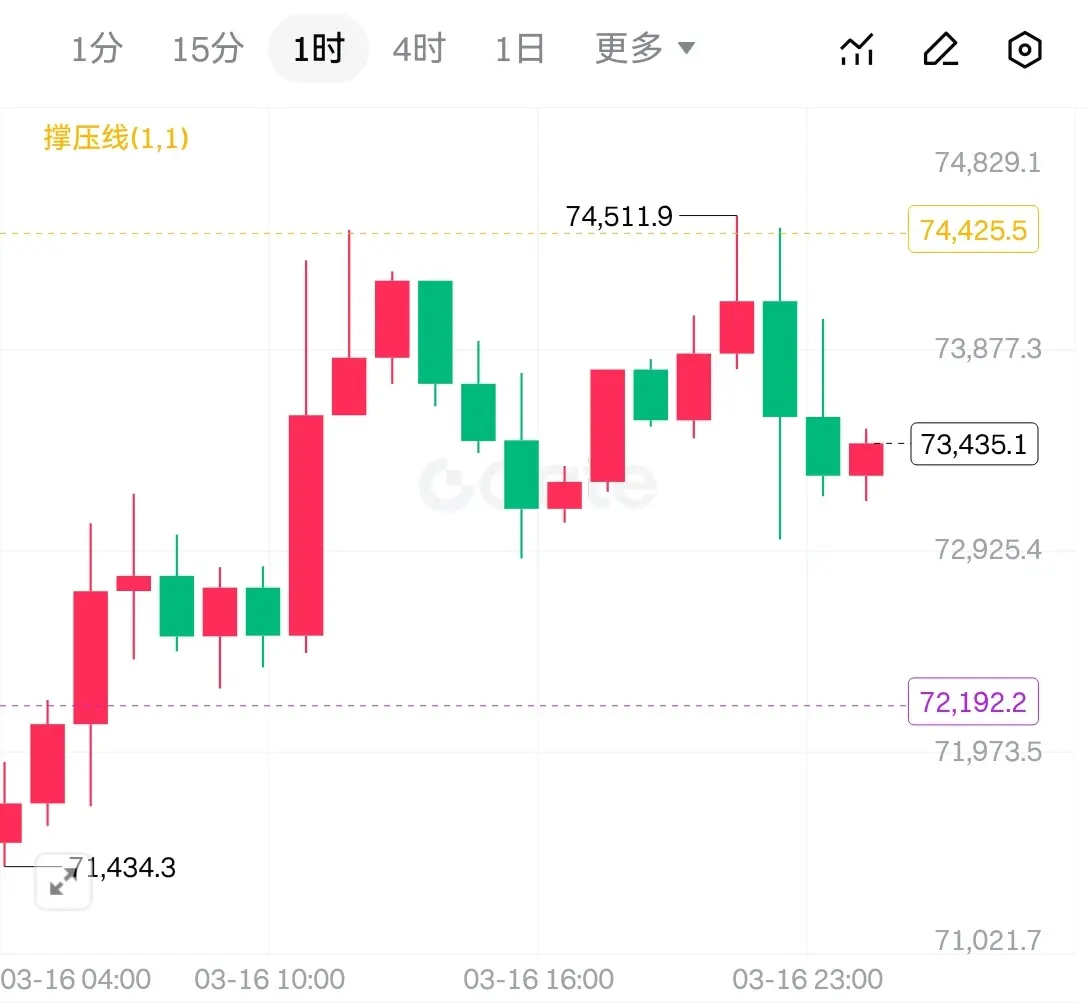
$BTC 3.17 Early Morning Bitcoin Ethereum Market Analysis and Trading Recommendations
From the current market perspective, the daily level continues with bullish candles pushing higher, and coin prices have rebounded near the upper Bollinger Band. Although the overall trend remains relatively strong, resistance above is gradually becoming evident. Key resistance level remains in the upper band area of the ascending channel. If a second breakthrough cannot be formed, short-term upside space may be limited, and the market may enter a cyclical adjustment rhythm. From a technical indicator perspec
From the current market perspective, the daily level continues with bullish candles pushing higher, and coin prices have rebounded near the upper Bollinger Band. Although the overall trend remains relatively strong, resistance above is gradually becoming evident. Key resistance level remains in the upper band area of the ascending channel. If a second breakthrough cannot be formed, short-term upside space may be limited, and the market may enter a cyclical adjustment rhythm. From a technical indicator perspec
BTC0.67%
- 報酬
- いいね
- コメント
- リポスト
- 共有