


📣Ethereum evening short positions are once again perfectly closed with profit! (2000 is about to break!)
Ethereum's evening short positions are precisely managed again, with a short at 2150-2130 and take-profit at 2040, which was perfectly reached. Nearly 100 points of profit secured.
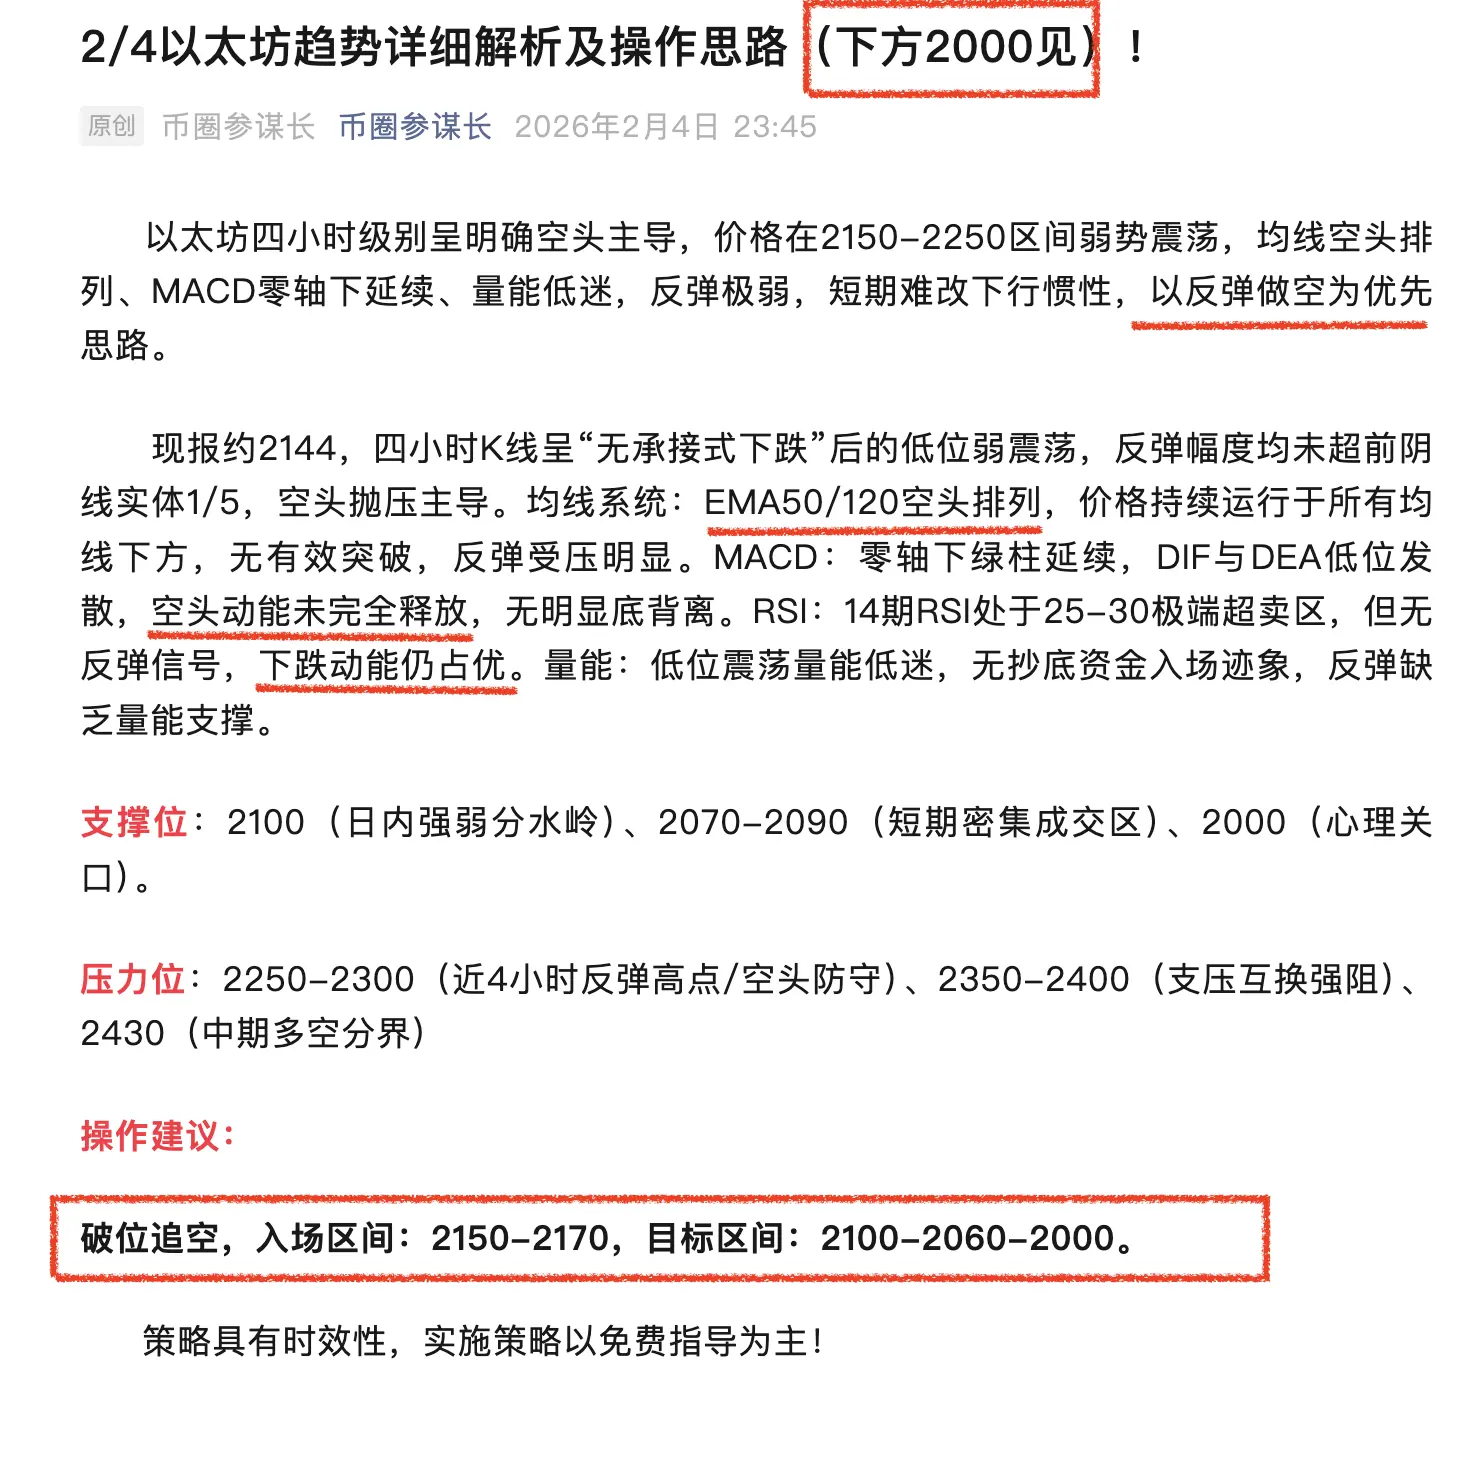
The 4-hour chart shows a clear bearish dominant downtrend continuation pattern, with the price around $2090, a 5.8% decline over 24 hours, fluctuating between $2068 and $2267. Although RSI has entered the oversold zone, there are no effective signs of a bottoming out. In the short term, the focus remains on rebound selling, with bulls only attempting very light positions at strong support levels.
The 4-hour chart displays a descending flag pattern, with the price continuously trading below the moving average system. EMA20 ($2657) acts as a strong resistance, and the Supertrend indicator signals a persistent bearish trend. The market is strongly correlated with Bitcoin, moving weaker together. RSI at 23.12 (oversold) suggests short-term downward momentum may be weakening, but the trend remains unchanged. Oversold conditions can persist without indicating a reversal. MACD is operating at low levels without clear bullish divergence, indicating bearish momentum still dominates. Rebounds require volume confirmation and indicator resonance. KDJ shows a potential golden cross at low levels but has not formed an effective breakout, making rebound signals fragile and requiring price to stabilize above resistance. The Bollinger Bands are near the lower band with narrowing channels, indicating volatility may increase. A break below $2079 could accelerate the downward move.
Key levels:
Support: $2070 (intraday low), $2050 (strong support), $2000 (psychological and technical resonance level).
Resistance: $2130-2170 (Bollinger middle band + MA30), $2200-2220 (strong resistance), $2250 (trend reversal threshold).
Trading strategy and risk management suggestions:
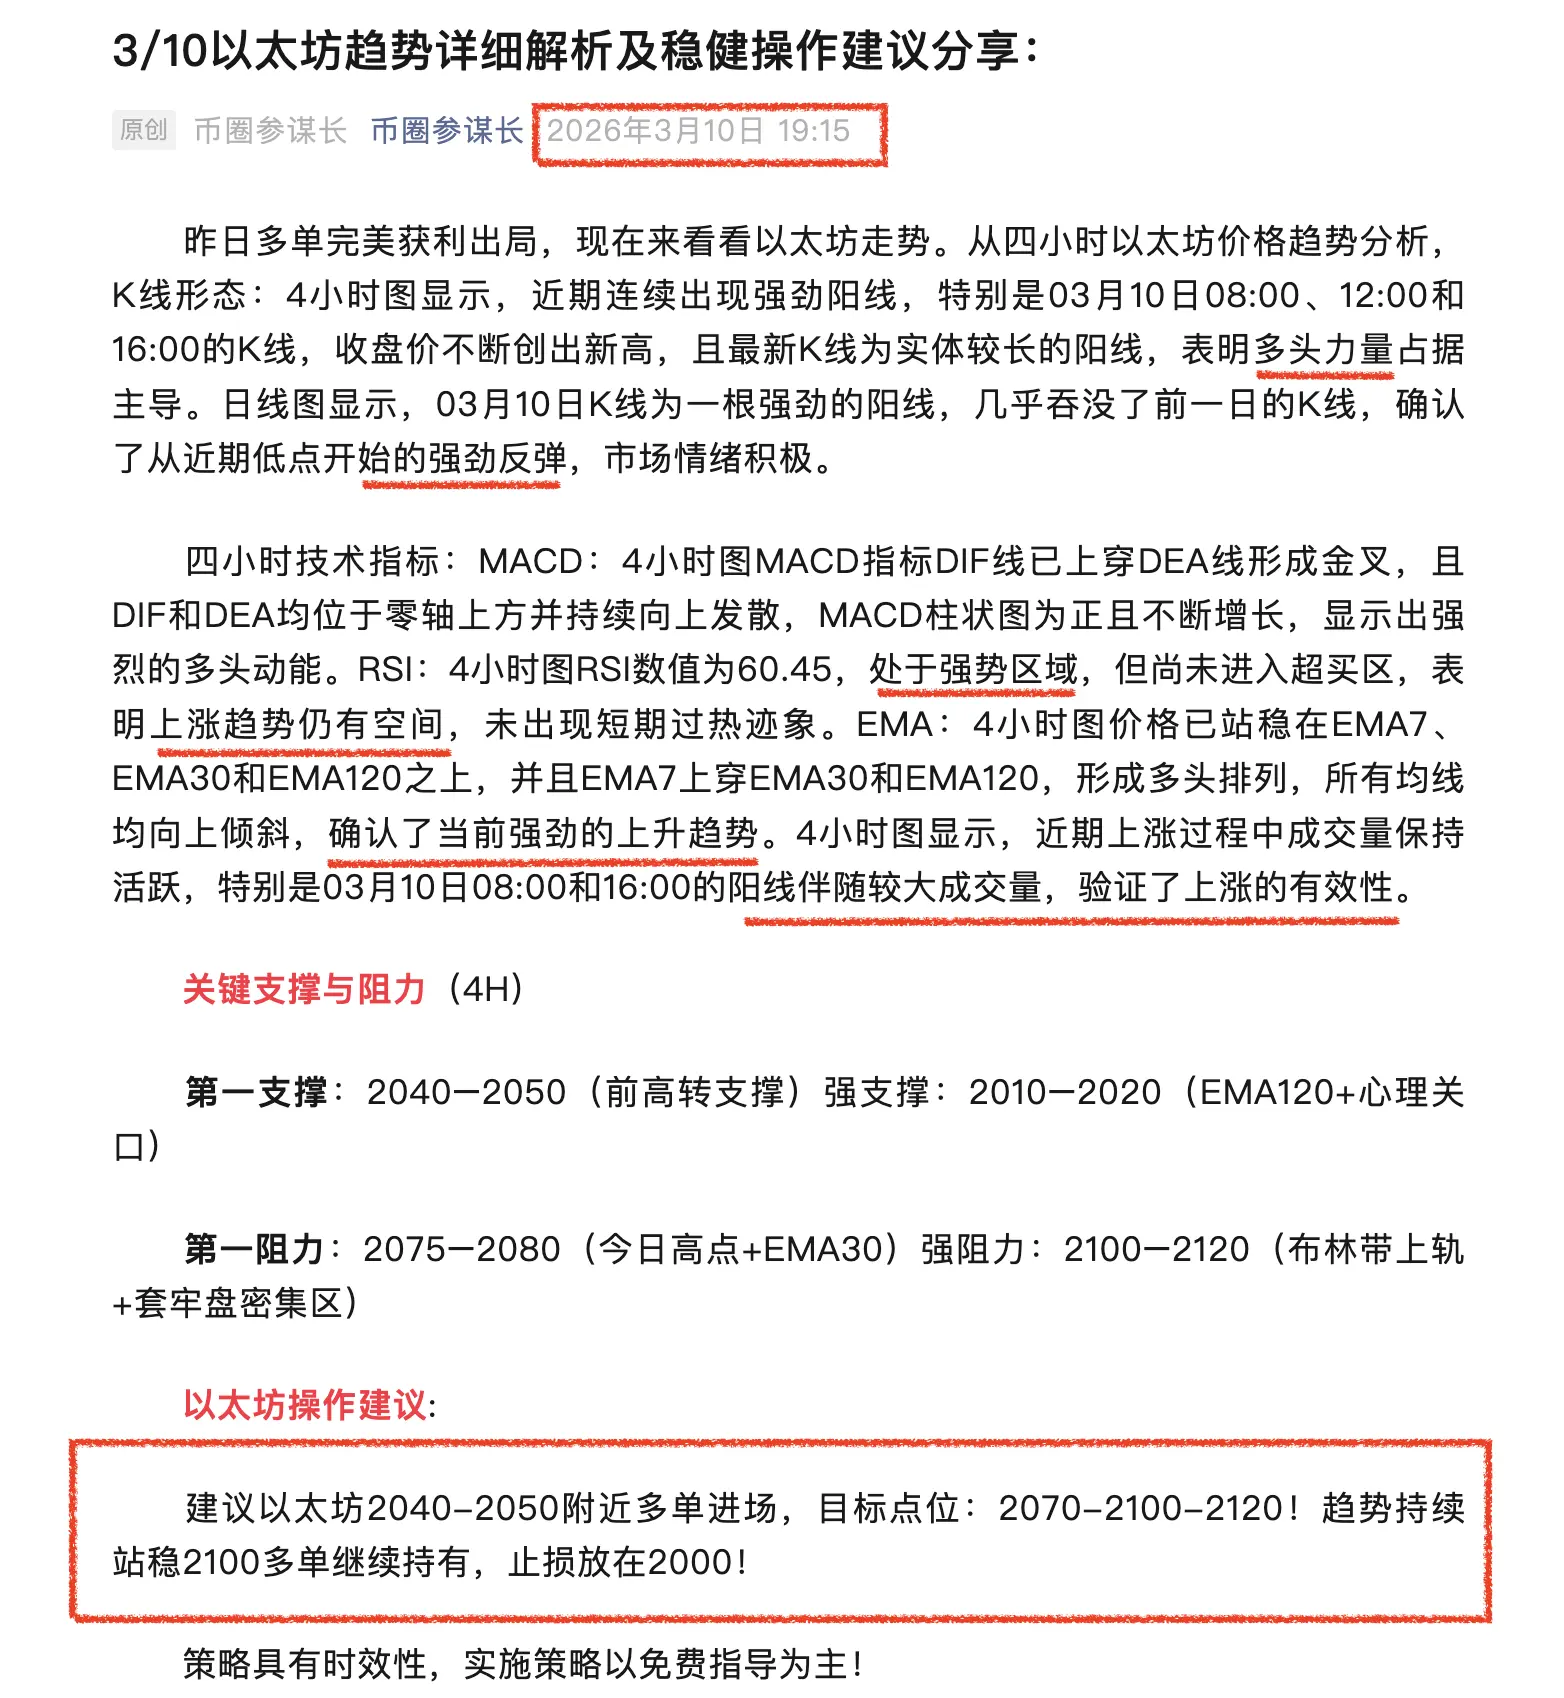
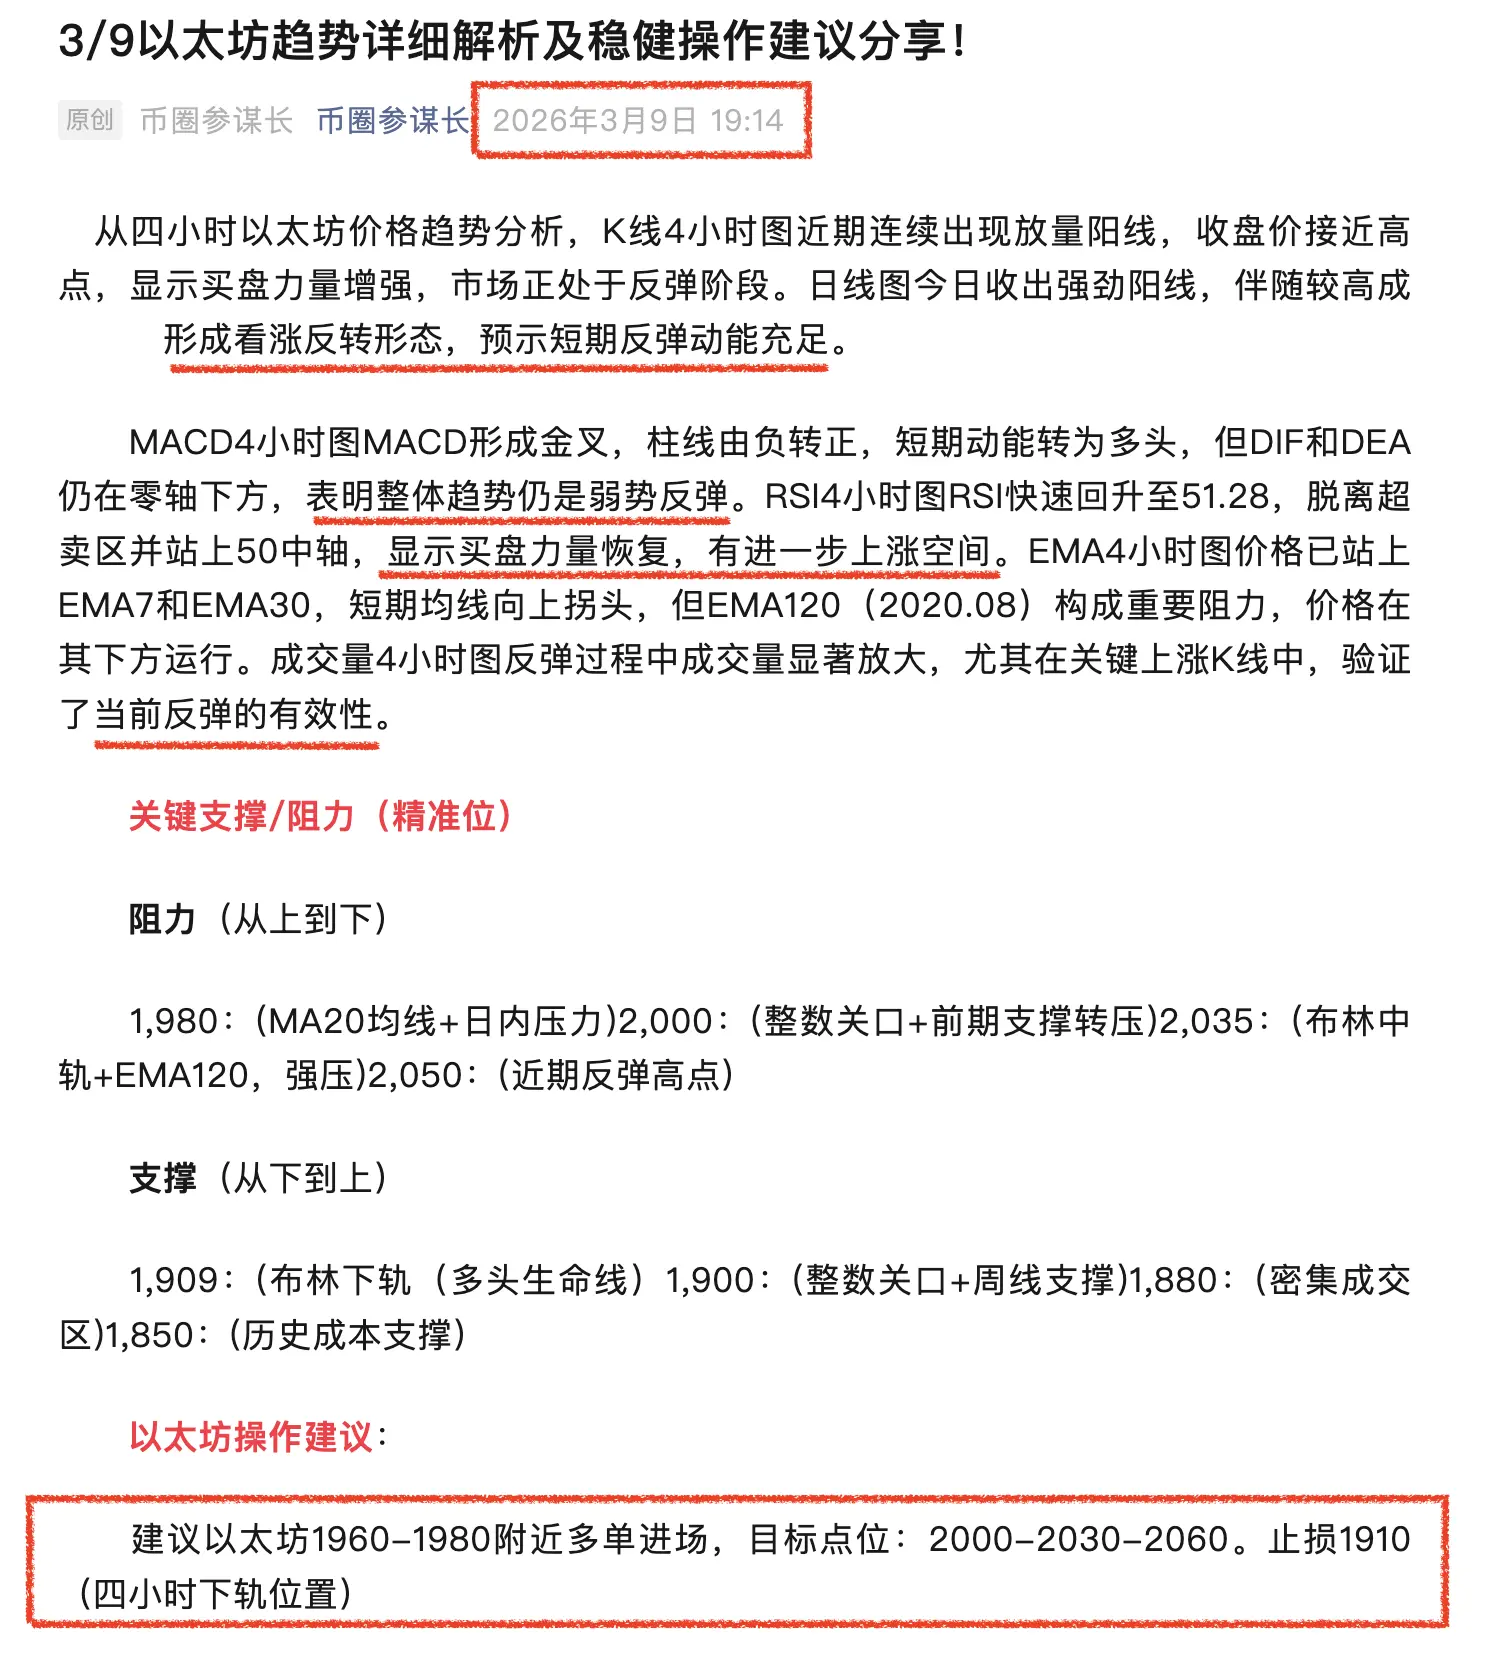
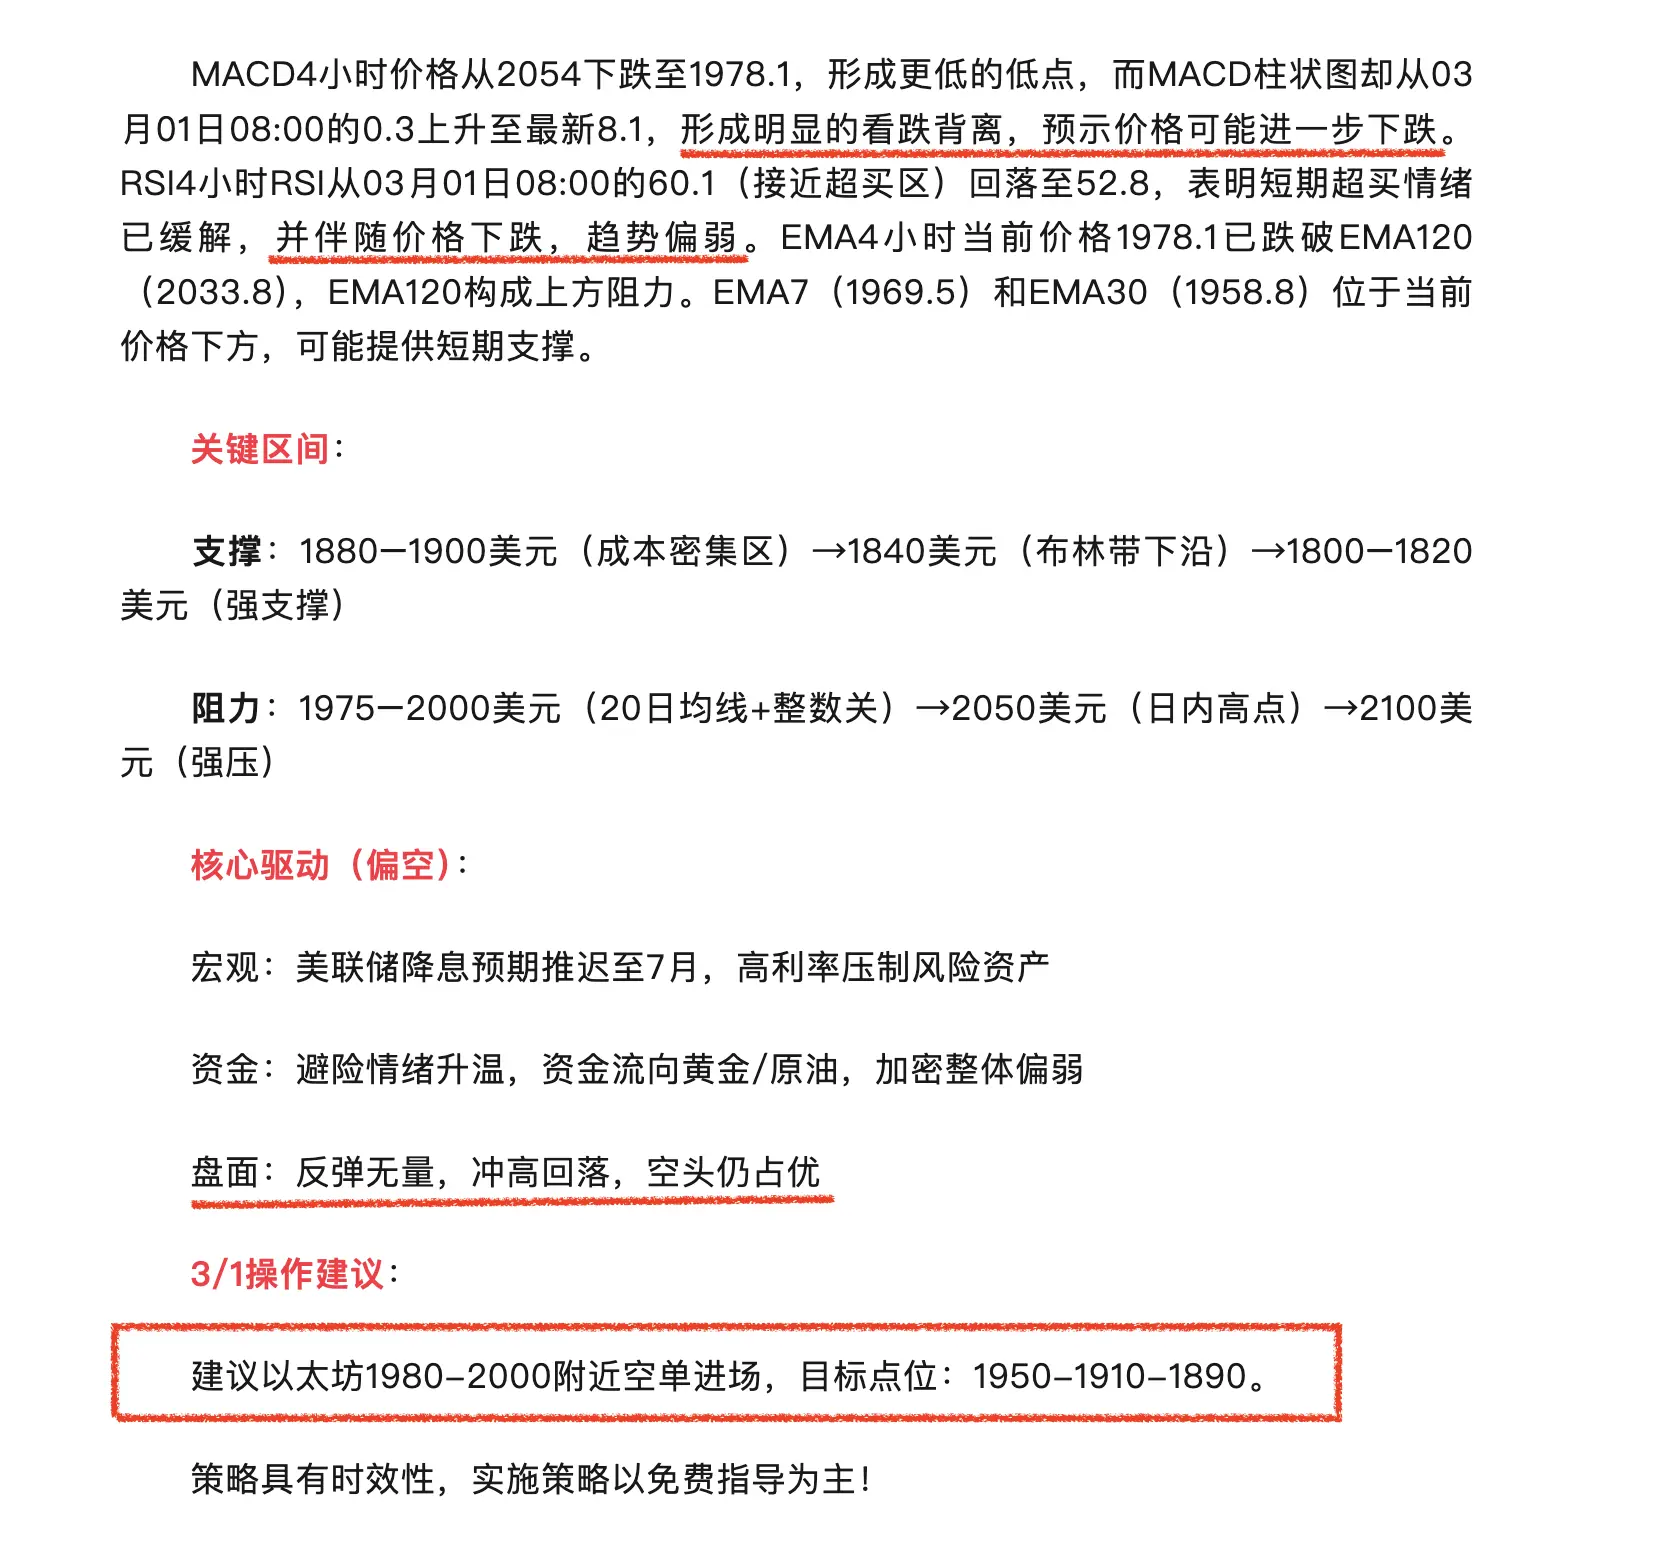
Bearish strategy (main): Light short positions on rebounds to $2130-2170, with a stop-loss above $2220, targeting $2070. If broken, further target $2000. Risk per position controlled within 1%-2%.
Bullish trial (auxiliary): Only attempt very light long positions if $2070 is stabilized and a 4-hour bullish candle forms. Add positions on pullback to $2050 with bullish divergence. Total position size should not exceed 2%. Stop-loss immediately if below $2050.
Risk points: Current volatility is high (ATR about $150-200/day), so set wide stop-losses. Prioritize capital protection and avoid heavy bottom-fishing without clear signs of a reversal.
Key signals and future outlook:
Reversal confirmation: A volume breakout above $2220 on the 4-hour chart with stabilization, MACD forming a golden cross, and RSI exiting oversold zone could shift to a bullish outlook, targeting $2250-2300.
Downward acceleration: Breaking below $2050 with volume could open further downside space, targeting below $2000. Be decisive in exiting or shorting accordingly.
Strategy timeliness: Implement strategies based on free guidance from #BTC何时反弹? #加密市场观察 !
Ethereum's evening short positions are precisely managed again, with a short at 2150-2130 and take-profit at 2040, which was perfectly reached. Nearly 100 points of profit secured.
The 4-hour chart shows a clear bearish dominant downtrend continuation pattern, with the price around $2090, a 5.8% decline over 24 hours, fluctuating between $2068 and $2267. Although RSI has entered the oversold zone, there are no effective signs of a bottoming out. In the short term, the focus remains on rebound selling, with bulls only attempting very light positions at strong support levels.
The 4-hour chart displays a descending flag pattern, with the price continuously trading below the moving average system. EMA20 ($2657) acts as a strong resistance, and the Supertrend indicator signals a persistent bearish trend. The market is strongly correlated with Bitcoin, moving weaker together. RSI at 23.12 (oversold) suggests short-term downward momentum may be weakening, but the trend remains unchanged. Oversold conditions can persist without indicating a reversal. MACD is operating at low levels without clear bullish divergence, indicating bearish momentum still dominates. Rebounds require volume confirmation and indicator resonance. KDJ shows a potential golden cross at low levels but has not formed an effective breakout, making rebound signals fragile and requiring price to stabilize above resistance. The Bollinger Bands are near the lower band with narrowing channels, indicating volatility may increase. A break below $2079 could accelerate the downward move.
Key levels:
Support: $2070 (intraday low), $2050 (strong support), $2000 (psychological and technical resonance level).
Resistance: $2130-2170 (Bollinger middle band + MA30), $2200-2220 (strong resistance), $2250 (trend reversal threshold).
Trading strategy and risk management suggestions:
Bearish strategy (main): Light short positions on rebounds to $2130-2170, with a stop-loss above $2220, targeting $2070. If broken, further target $2000. Risk per position controlled within 1%-2%.
Bullish trial (auxiliary): Only attempt very light long positions if $2070 is stabilized and a 4-hour bullish candle forms. Add positions on pullback to $2050 with bullish divergence. Total position size should not exceed 2%. Stop-loss immediately if below $2050.
Risk points: Current volatility is high (ATR about $150-200/day), so set wide stop-losses. Prioritize capital protection and avoid heavy bottom-fishing without clear signs of a reversal.
Key signals and future outlook:
Reversal confirmation: A volume breakout above $2220 on the 4-hour chart with stabilization, MACD forming a golden cross, and RSI exiting oversold zone could shift to a bullish outlook, targeting $2250-2300.
Downward acceleration: Breaking below $2050 with volume could open further downside space, targeting below $2000. Be decisive in exiting or shorting accordingly.
Strategy timeliness: Implement strategies based on free guidance from #BTC何时反弹? #加密市场观察 !