Overview: BTC and Crypto Markets Plunge Rapidly
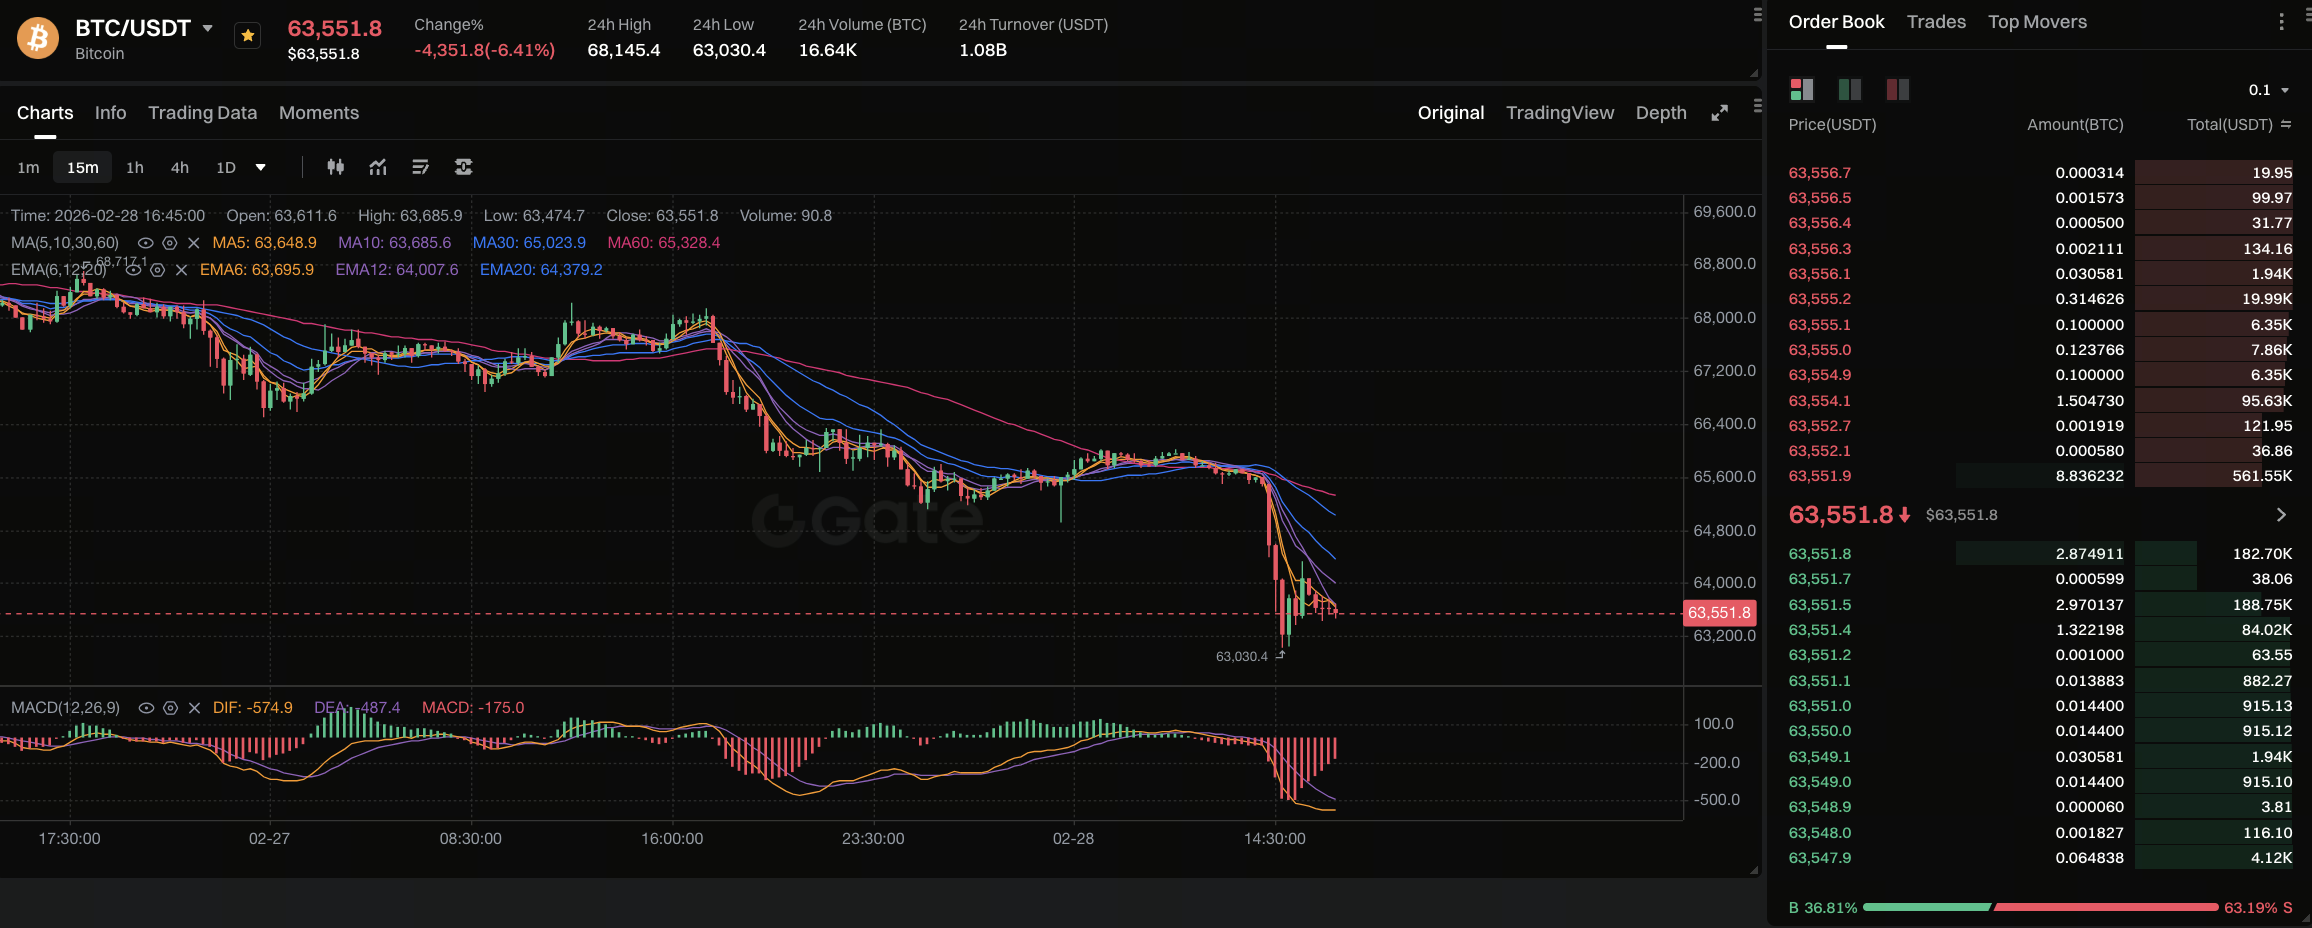
Image source: Gate
February 28, 2026 — As news broke of military strikes by the US and Israel against Iran, Bitcoin’s price dropped sharply in a matter of hours. Market data shows BTC fell from roughly $64,000 to below $63,000, a 3–5% decline, while the total crypto market lost tens of billions of dollars in value.
- BTC price plunged quickly — dropping below the critical $64,000 technical level within hours of the announcement.
- Ethereum and other major tokens also slid more than 2%.
- Within moments of the news, hundreds of millions of dollars in leveraged positions were forcibly liquidated.
This downturn isn’t an isolated event; it’s the result of geopolitical risk, market sentiment, and structural trading mechanisms converging. We’ll break down each factor in detail below.
How Geopolitical Shocks Impact Crypto Markets
Geopolitical conflicts typically affect markets through three main channels:
- Reduced risk appetite
- Short-term capital withdrawal
- Asset repricing
In the early stages of conflict, investors usually focus on reducing risk exposure rather than allocating to high-volatility assets. Bitcoin’s current role in the global asset landscape is closer to a high-volatility risk asset, making its price highly sensitive to shifts in sentiment and liquidity.
When global investors move into “defensive mode,” cash flows toward short-term safe assets and risk assets come under broad pressure. As a market highly sensitive to liquidity, crypto often reacts with amplified volatility.
This reaction doesn’t mean the long-term trend has changed—it’s a short-term repricing of risk.
Leverage Structure: Why Declines Accelerate
The key accelerator in this selloff is leverage in the derivatives market.
Perpetual contracts and high-leverage trades now account for an increasing share of crypto trading. During upward volatility, long leverage builds up. When prices fall below critical technical levels, chain liquidation mechanisms kick in.
The process unfolds as follows:
- Prices drop
- Long positions are forcibly liquidated
- Liquidation sell orders push prices lower
- More positions are passively liquidated
This mechanism exists in traditional markets, but because crypto trades 24/7 and has relatively shallow liquidity, price swings are faster and more concentrated.
This round saw mostly long liquidations, indicating prior market optimism and concentrated leverage. When a one-sided expectation faces a sudden external shock, price adjustments accelerate sharply.
Technical Structure and Algorithmic Trading Resonance
Beyond leverage, technical structure also drives short-term moves. Bitcoin had been consolidating in a range, with key round numbers providing psychological and technical support. When prices broke below the range, quantitative strategies and algorithmic trading models executed synchronized sell orders.
In modern markets:
- Manual traders have limited reaction time
- Algorithmic trading responds instantly
- High-frequency trading amplifies volatility
So, breaking a technical level isn’t just a price event—it’s a trigger for trading models.
This is why prices can plunge rapidly rather than retrace slowly.
Historical Comparison: Bitcoin in Risk Events
Looking back at major geopolitical conflicts and macro shocks, Bitcoin has typically moved in tandem with risk assets during the early stages.
Examples include:
- Early phase of the Russia–Ukraine conflict
- Middle East escalation
- Liquidity shocks during the pandemic’s onset
After an event breaks out, markets usually see liquidity contraction, not increased risk appetite. At this stage, Bitcoin acts more as a liquidity asset than a stable asset.
However, history shows that after the first round of panic pricing, Bitcoin has sometimes staged technical rebounds or even medium-term recoveries.
So early-stage performance during conflicts shouldn’t be extrapolated into a long-term trend.
Macro Variables: Energy, Inflation, and Rate Expectations
Geopolitical conflict’s medium-term impact often comes via energy prices.
If crude oil and natural gas prices keep rising, global inflation expectations may surge again, affecting monetary policy paths worldwide. If the market prices in higher rate expectations, risk asset valuations face renewed compression.
Bitcoin’s recent performance has been closely tied to liquidity cycles:
- Loose liquidity → risk assets rally
- Tight liquidity → high-volatility assets face pressure
Going forward, the key isn’t just the military situation—it’s whether the conflict alters the global liquidity environment.
On-Chain and Capital Flow Insights
On-chain activity during short-term volatility typically shows:
- Rising net BTC inflows to exchanges
- Increased stablecoin trading volume
- Rapid drop in derivatives open interest
If subsequent patterns include:
- Rising net outflows from exchanges
- Stablecoins returning to spot markets
- Leverage positions being rebuilt
This may signal the market has completed a deleveraging phase and is entering a new round of consolidation. The current stage looks like a “rapid deleveraging” rather than a structural collapse.
Risk Assessment: Short-Term Volatility or Trend Shift?
To assess this correction, monitor three variables:
- Whether the conflict escalates
- Whether global equities remain under sustained pressure
- Whether leverage in the crypto market is rebuilt
If the conflict stays contained, market sentiment could recover quickly. If it turns into a prolonged regional conflict, risk premiums may persist.
From a cyclical perspective, Bitcoin remains within its medium-term trend structure. The current decline appears to be a rapid correction driven by sentiment and leverage.
But in highly volatile markets, any single judgment must remain flexible.
Conclusion: Structural Volatility Driven by Risk Repricing
This Bitcoin downturn is not the result of a single negative factor, but of multiple mechanisms acting together:
- Geopolitical shocks reduce risk appetite
- Concentrated leverage structure amplifies forced liquidations
- Loss of technical levels triggers algorithmic selling
- Liquidity contraction intensifies volatility
In the global asset landscape, Bitcoin remains a high-volatility risk asset, making its price highly sensitive to unexpected events. History shows that after markets undergo deleveraging and risk release, they often seek new equilibrium. The true driver of future trends isn’t a single conflict, but the lasting impact of conflict on global liquidity and risk appetite.
During periods of heightened uncertainty, controlling leverage and managing risk exposure are often more important than simply trying to predict direction.