Summary
-
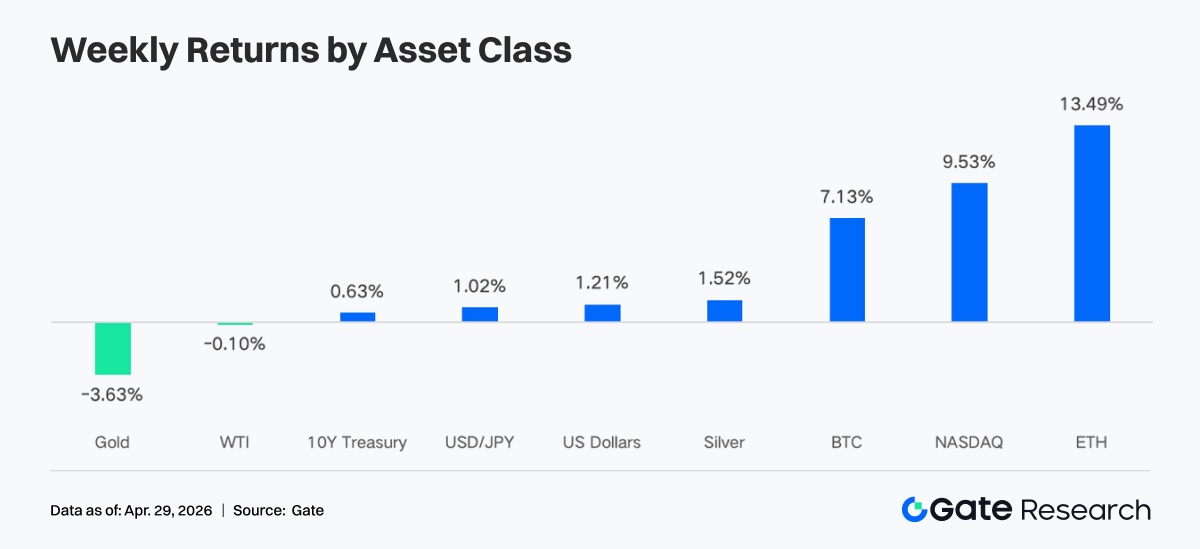
Last week, the overall crypto market showed a pattern of "cautious optimism," driven mainly by a marginal easing of geopolitical risks in the Middle East and rising expectations for Fed rate cuts later this year. BTC rose from $68,000 to above $77,000, while BTC ETFs continued their net inflow trend.
-
TradFi trading activity cooled somewhat from the safe-haven peak in March, but gold remained the core trading asset, while the share of equities and commodities rebounded.
-
On-chain capital continued to concentrate in high-liquidity and high-turnover scenarios. PancakeSwap’s weekly trading volume approached $36 billion, while the Solana ecosystem showed characteristics of "small-size, high-frequency trading."
-
Stablecoin capital clearly flowed back into settlement-oriented USD assets. USDT supply rose to nearly $200 billion, while yield-bearing stablecoin USDe saw net outflows of nearly $2 billion in a single week.
-
After the rsETH incident, on-chain risk appetite declined significantly. Aave’s lending balance plunged 26.7% in a single week, core stablecoin borrowing rates rose sharply, and capital accelerated its migration to competing protocols such as Spark.
-
The derivatives market showed a typical divergence structure of "negative funding rates + high-level consolidation." Short positions in BTC perpetual contracts remained crowded, but spot and institutional buying still provided support; meanwhile, implied volatility and options trading volume rose simultaneously.
-
On the institutional and platform side, spot trading was up +20.09% week-over-week, with 30+ new business opportunities added. CrossEx trading volume and asset scale hit new highs again at +79% and +816% respectively, as institutions accelerated cross-exchange arbitrage and hedging. The 3.0 trading system architecture is advancing, infrastructure continues to improve, and institutional capital onboarding is speeding up.
1. Market Focus Analysis
Last week, the overall sentiment in the crypto market was characterized by "cautious optimism," mainly driven by the marginal easing of geopolitical tensions in the Middle East, rising expectations for Fed rate cuts, and continued institutional buying effectively offsetting the profit-taking pressure from short-term holders. During this period, BTC rose from around $68,000 to above $77,000, a gain of about 12%.
Trump extended the ceasefire agreement with Iran, indicating that he hopes to resolve the conflict through diplomatic means, but negotiations on a longer-lasting peace agreement are currently deadlocked. The Strait of Hormuz, through which about one-fifth of the world’s oil supply passes, remains closed, pushing oil prices back up to $95 per barrel. In recent weeks, the market has largely priced out the tail risks of the Middle East situation. BTC and ETH continued to rise, with ETH showing greater resilience due to ecosystem expectations, while equity markets also recovered from the March sell-off. As the Federal Open Market Committee (FOMC) meeting approaches, yields have remained stable, with the 10-year Treasury yield around 4.30%. The U.S. Dollar Index has held near 98, entering a consolidation phase after falling from above 100. Under pressure from the dollar and interest rates, gold has generally faced headwinds. Meanwhile, expectations for a Bank of England rate hike have strengthened, and the British pound has rebounded to around 1.36. If rates are raised by 22 basis points before year-end, this could weaken the dollar’s key structural support.
Although this week’s FOMC meeting will most likely leave rates unchanged, the market will focus on any changes in the statement’s wording regarding inflation, war-related shocks, and risk balance, as well as whether there are any signals of adjustment to the long-term neutral rate of 3.1%. Market expectations for the Fed’s rate-cut path this year have clearly heated up. The probability of a 25-basis-point cut before December has now risen to 39%, up from the previous 23%. This change is partly due to the U.S. Department of Justice dropping its investigation into Powell, further clearing the way for Waller to succeed him as Fed Chair, and partly reflects market expectations that if oil prices return to a normal range, the Fed will have more room to ease in the second half of the year.
2. Liquidity Analysis
2.1 BTC ETF Net Asset Value Has Exceeded $102.64 Billion
Last week, BTC ETFs extended the continuous net inflow trend that began on April 14, recording 4 days of positive inflows over the week, with total weekly net inflows of $585 million. ETH ETFs recorded weekly net inflows of $87.3 million. Although the pace of inflows slowed compared with the previous week, overall market sentiment remained optimistic, and institutional investors continued to demonstrate strong conviction in long-term holdings.
Top BTC ETF products by net inflow:
-
IBIT (BlackRock): weekly net inflow of $476.6M
-
ARKB (ARK 21Shares): weekly net inflow of $59.6M
Top ETH ETF products by net inflow:
-
ETHA (BlackRock): weekly net inflow of $61.9M
-
ETHB (Bitwise): weekly net inflow of $47.8M
Capital flows showed a clear concentration effect among the top products. BlackRock’s IBIT dominated with $476 million in weekly net inflows, contributing more than 80% of total BTC ETF inflows for the week; ETHA similarly led the ETH ETF market with $61.9 million. Meanwhile, Grayscale’s GBTC and ETHE continued to face persistent outflow pressure, reflecting that the structural migration by investors from legacy high-fee products to newer low-fee products has not yet ended.
As of April 24, the total net asset value of U.S. spot BTC ETFs had exceeded $102.64 billion, accounting for about 6.5% of Bitcoin’s total market capitalization. ETH ETFs had a total net asset value of about $13.79 billion, accounting for around 4% of Ethereum’s total market capitalization. In terms of capital trends, BTC ETF net flows year-to-date have turned positive to about $1.85 billion, and market confidence is recovering. However, whether this can break the historical cumulative net inflow high still depends on the outcome of the bulls-versus-bears battle around the $80,000 level.
2.2 TradFi Liquidity
-
TradFi Perp DEX: Over the past week, trading volume continued to decline slightly from previous weeks, with the latest weekly total turnover falling to around $10 billion, showing that after the marginal easing of Middle East tensions and the recovery in market risk appetite, the previously high trading activity driven by safe-haven sentiment is gradually cooling. In terms of asset structure, commodities still hold an absolute dominant position, with gold-related asset trading remaining the core of the market and accounting for most of the volume. However, compared with the peak in March, the share of commodities has narrowed somewhat, while the share of equity assets such as indices, ETFs, and stocks has rebounded slightly, indicating that capital is beginning to spread from a single safe-haven trade into a broader range of risk assets.
-
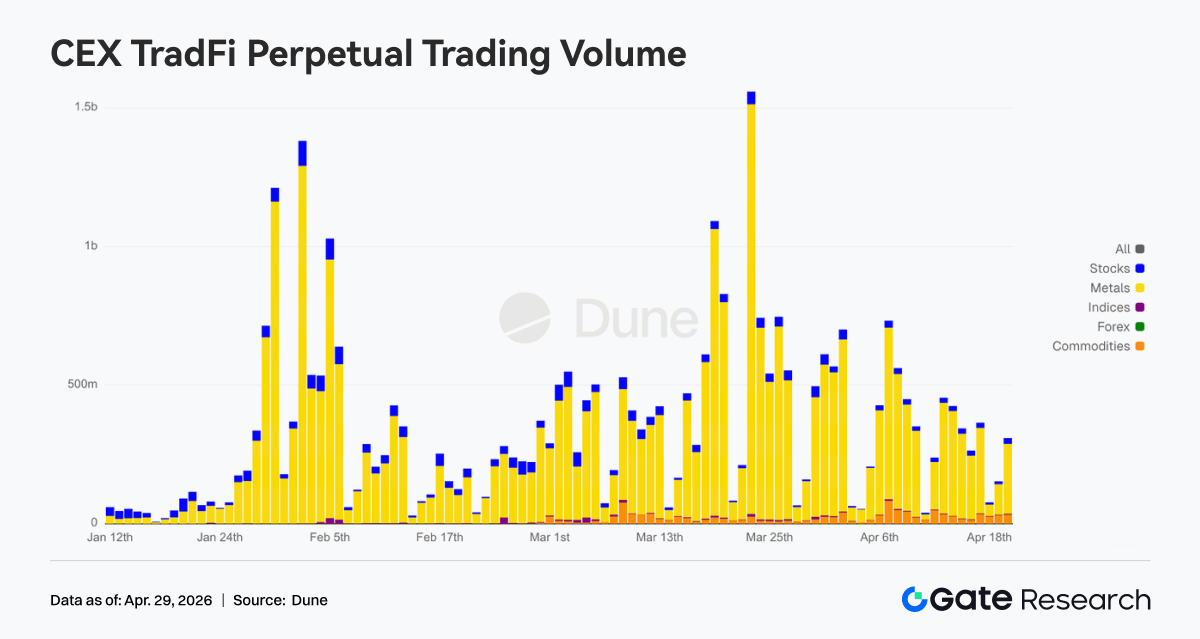
TradFi Perp CEX: Since April 20, overall market trading activity has retreated from the March peak, but remains in a relatively active range. In terms of trading structure, precious metals such as gold still occupy an absolutely dominant position. However, compared with the peak daily volume of more than $1.5 billion in mid-to-late March, recent overall trading volume has clearly contracted, with most trading days ranging from $300 million to $500 million, reflecting that market sentiment is gradually shifting from extreme safe-haven positioning to a phase of consolidation and digestion. At the same time, the share of stocks and commodity sectors has risen slightly, indicating that capital is beginning to spread from single gold trades into a broader range of TradFi assets, with some users starting to reposition into equities and cyclical assets.
-
CEX TradFi Asset Categories: Over the past week, the number of CEX TradFi asset categories expanded further. The total number of TradFi asset categories across the three major CEXs (counting only TradFi and CFD sectors, excluding perpetual contracts) increased from 955 to 956, up 0.1% week-over-week. Among them, the growth in stocks was the most significant, rising from 590 to 594. Last week, among the major exchanges, only Gate added 4 stock TradFi assets, driving the overall week-over-week increase of 0.7%.
-
TradFi Order Book Depth: We selected XAUT, the TradFi asset with the highest trading volume, to analyze its order book depth (Delta). From April 20 to 22, market depth Delta showed multiple sharp negative readings, especially around the 21st when it once approached negative $600,000, while the XAUT price also quickly fell from around $4.78K to below $4.70K, indicating a temporary cooling in gold-related safe-haven sentiment. However, after April 22, the order book structure clearly turned more bullish, with positive green Delta continuing to expand and one-sided bid depth frequently staying in the $300,000 to $800,000 range. Around the 23rd, there was even a bid peak close to $1 million, indicating that downside support capital strengthened significantly. Overall, XAUT is currently in a phase of "weaker price but improving liquidity support," indicating that although the Middle East situation has not completely subsided and rate-cut expectations are rising, demand for gold-related asset allocation still exists, but short-term momentum for chasing prices higher is clearly weaker than during the previous safe-haven peak.
3. On-Chain Data Insights
3.1 Trading Flows Back Into Spot and High-Turnover Scenarios, with Liquidity Further Concentrated at the Top
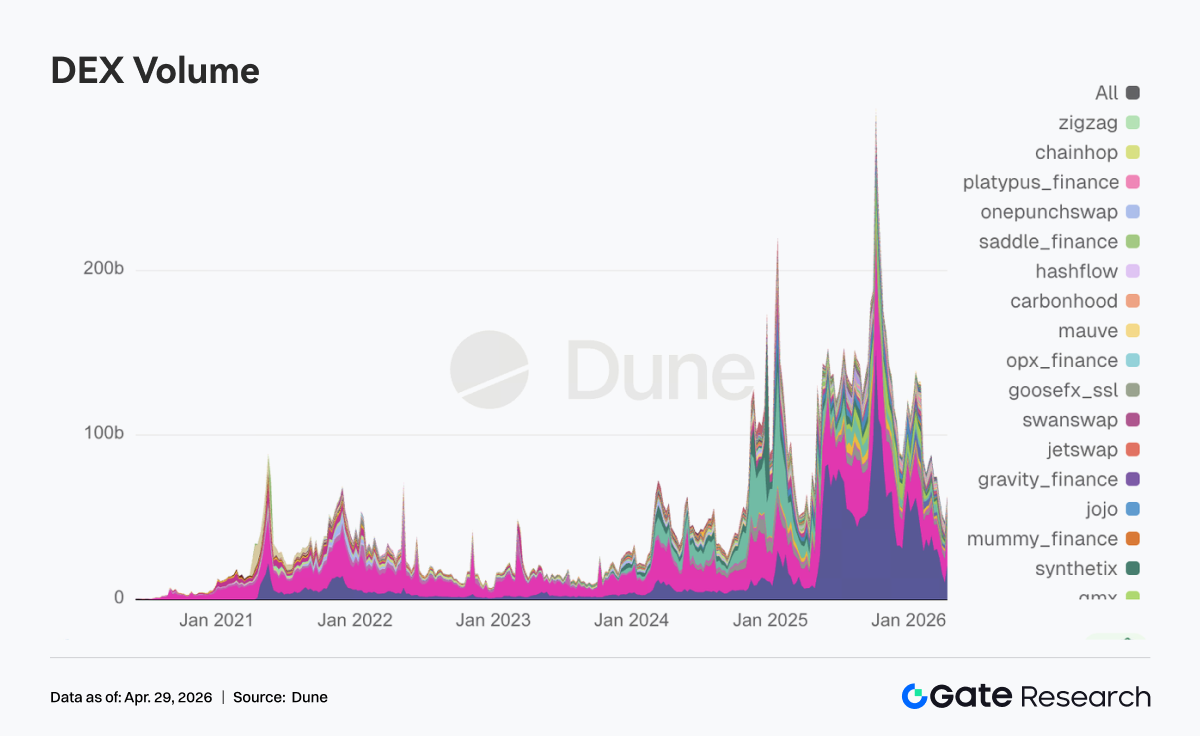
This week, PancakeSwap trading volume was nearly $36 billion, significantly higher than Uniswap’s $18.3 billion; Aerodrome, Curve, and Fluid were each in the $2.5 billion to $3.5 billion range. On the Solana side, Raydium and Meteora were each around $1 billion, but with more than 100 million transactions, showing small-size, high-frequency characteristics. Trading volume remained in the high range, indicating that on-chain trading demand has not shrunk significantly. However, as capital shifts from credit-based DeFi to low-fee, high-turnover spot trading scenarios, liquidity is also becoming more concentrated in the leading pools.
3.2 Stablecoin Capital Concentrates in Settlement-Oriented USD Assets, While USDe Sees Nearly $2 Billion in Weekly Net Outflows
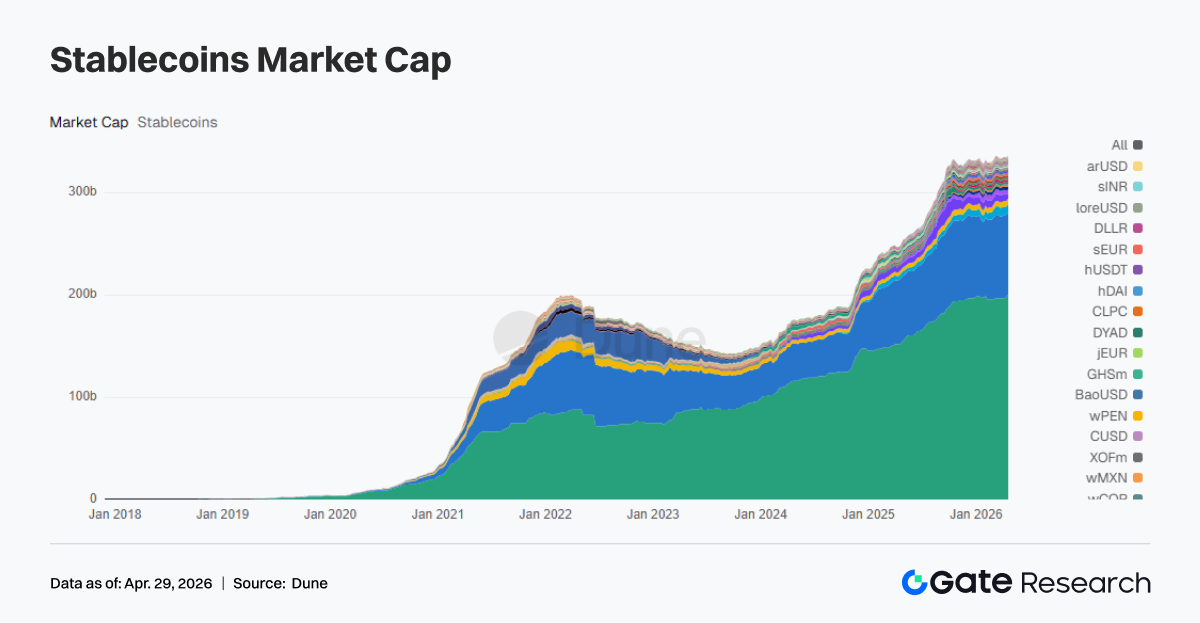
Over the past week, USDT supply rose to $199.959 billion, up $2.418 billion week-over-week; USDC was $80.391 billion, down $184 million; USDS was $8.136 billion, up $340 million; USDe was $4.410 billion, down $1.997 billion; PYUSD was $2.750 billion, down $677 million. This week, stablecoin capital as a whole concentrated into USD assets that can be directly settled and quickly transferred, while yield-bearing and synthetic stablecoins saw clear net outflows, with USDe alone recording nearly $2 billion in net outflows. Leading stablecoins are all reinforcing the priority of settlement layers and compliant assets. Circle and OSL launched 1:1 USD/USDC conversion and a unified margin system, while Tether cooperated with law enforcement to freeze $344 million in USDT.
3.3 LST Risk Begins Pricing in Complex Pathways, While Leading Protocols All See Slight Declines
Leading ETH- and Solana-based LST protocols such as Lido, Rocket Pool, Jito, and Jupiter Staked SOL all recorded modest outflows of 2% to 5% over the past week. After the rsETH incident, the market did not reject staking yield itself, but is repricing the risks of cross-chain and restaking pathways. The scale of leading LST protocols declined slightly, while more complex yield-enhancement pathways saw more obvious pullbacks. Lido, as a representative leading LST protocol, recently proposed using up to 2,500 stETH to participate in the rescue effort, further demonstrating the broad impact of systemic risk and the need for relevant DeFi protocols to face it together.
3.4 Aave Lending Balance Drops Off a Cliff, with Capital Fleeing to Competitors
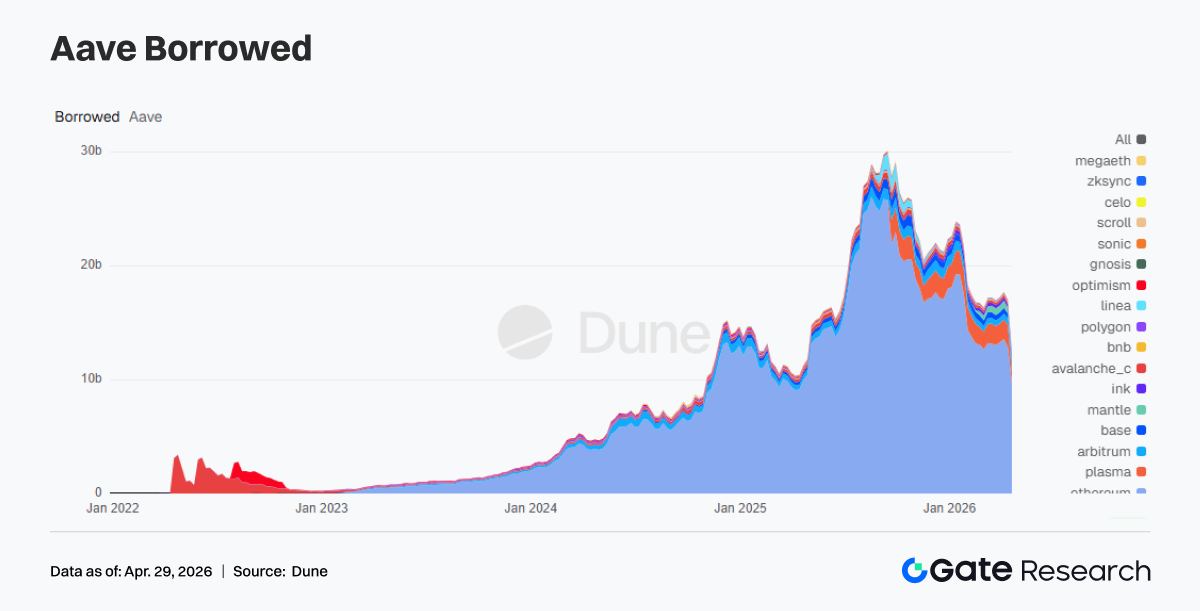
Aave’s total lending balance fell from $17.027 billion in the previous week to $12.481 billion, a decrease of $4.546 billion in one week, down -26.7%. Among this, Ethereum mainnet fell from $12.880 billion to $9.671 billion, and Plasma fell from $1.930 billion to $942 million. The lending balance showed a stepwise decline, representing a withdrawal of capital triggered by a risk event. After the rsETH incident, Aave froze multi-chain rsETH/wrsETH and restricted new WETH borrowing, further accelerating position contraction. Most of the capital did not leave on-chain, but instead shifted to Aave’s competitor Spark.
3.5 Liquidity Temporarily Tightens, with Aave Core Asset Rates Rising Significantly
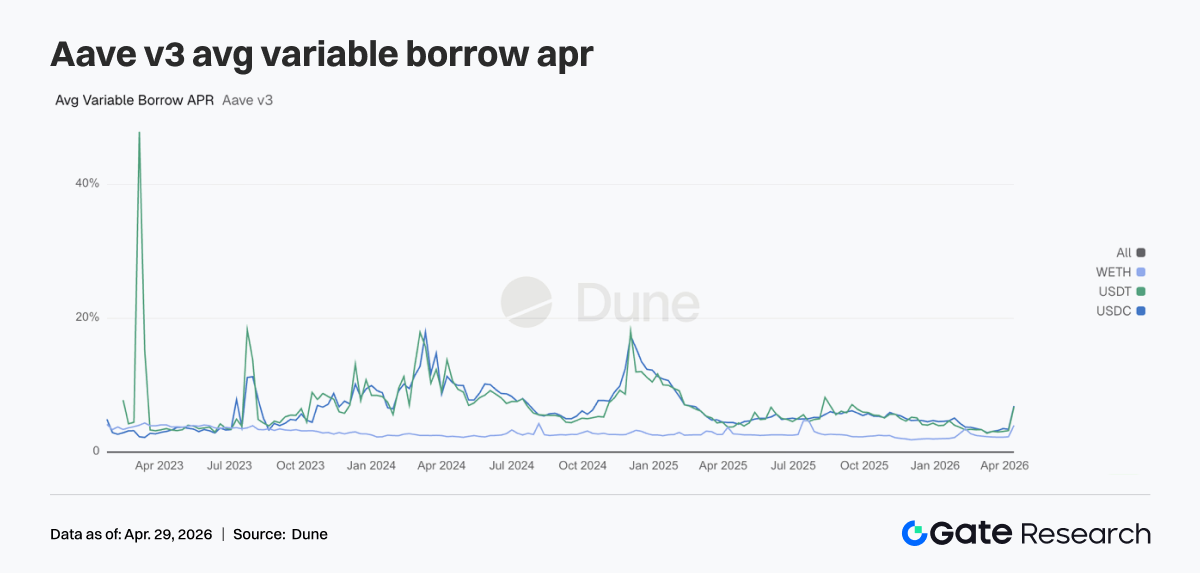
Over the past week, in Aave Ethereum V3, the average borrowing rate for USDC rose to 12.50%, up from the previous 6.91%; USDT rose to 13.30%, up from 6.76%; WETH rose to 5.21%, up from 4.00%. The rise in rates reflects a contraction in stablecoin liquidity. Due to the continued spread of risk caused by the rsETH security incident, the utilization rate of core assets such as USDC in the Ethereum Core market approached 100%, some liquidity could not be withdrawn, and borrowing rates remained high. Market demand for withdrawable dollar liquidity rose significantly, and the chain entered a liquidity repair phase. However, as joint rescue efforts gradually advance, asset rates are expected to return to normal ranges in the coming weeks.
3.6 Revenue Flows Back to Settlement and Volatility Pathways, Benefiting Lending Protocols
Tether and Circle revenues were basically flat; Hyperliquid and Pump both saw weekly declines of more than 10%; Aave’s revenue rose more than 40% in one week to nearly $2.9 million amid interest rate volatility. Stablecoin issuance and settlement remain the most stable sources of cash flow; revenues of trading protocols have begun to diverge, while lending protocols are capturing more revenue during volatility and position restructuring. Aave’s rising revenue despite declining lending scale also reflects shorter position duration and faster capital turnover.
4. Derivatives Tracking
4.1 Deeply Negative BTC Funding Rates Combined with Rising OI Continue to Strengthen the Short-Squeeze Structure
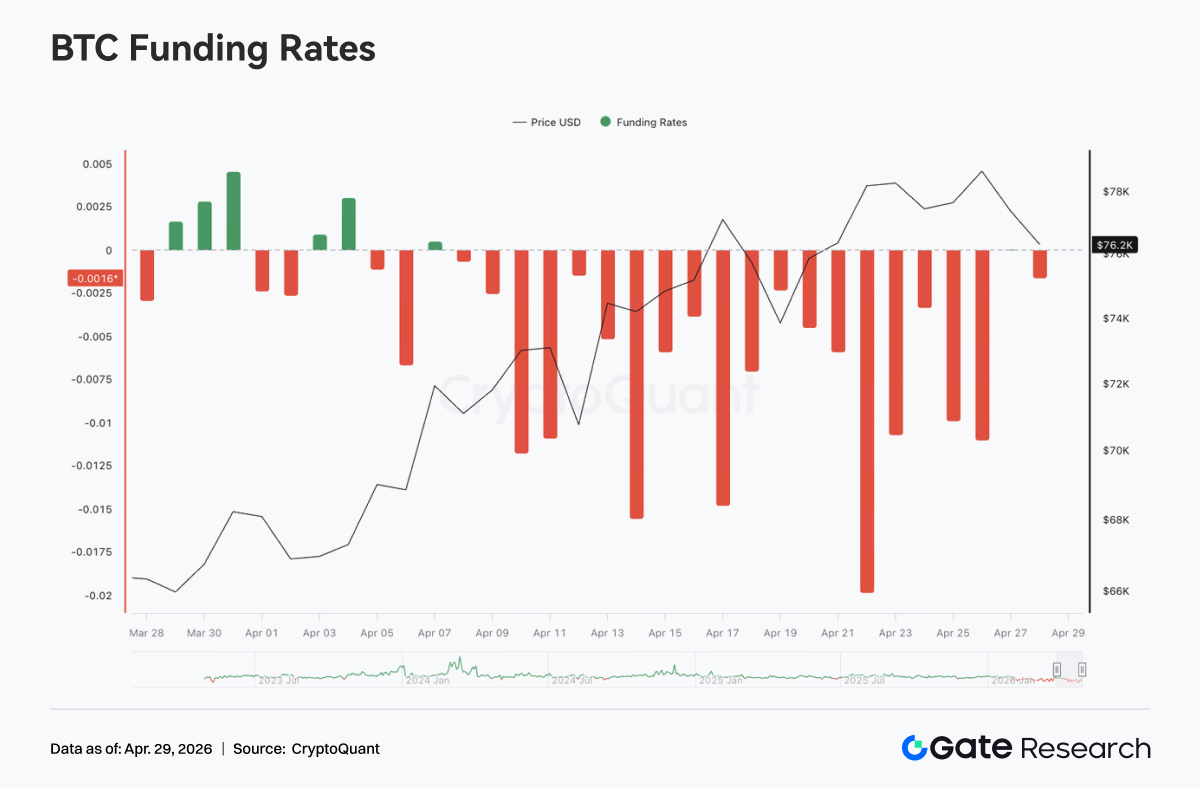
Over the past week, BTC perpetual contract funding rates remained in negative territory overall, and multiple periods of extreme negative values appeared from mid- to late April (with the lowest close to -0.02), showing that bearish sentiment continued to dominate the market and short crowding remained elevated. Correspondingly, BTC price has trended upward in a choppy fashion since early April and surged to around $78K around April 20, forming a typical divergence structure of "deeply negative funding rates but prices staying high," indicating that shorts continued to pay funding fees while also bearing upward price pressure.
At the same time, open interest (OI) as a whole showed a choppy upward trend, climbing from about $21B to above $25B. Although there were periodic pullbacks, the overall center of gravity clearly moved higher. Persistently negative funding rates combined with rising OI mean that during the process of prices strengthening in a choppy way, newly added positions were mainly shorts, forming a typical divergence structure of "shorts adding positions + prices not falling."
Around April 17 and April 22, OI rose rapidly, corresponding to phased price gains and high-level consolidation, while funding rates remained deeply negative, indicating that during the price rise, shorts did not effectively stop out and instead continued to add positions. This combination of "negative funding rates + OI expansion + price strength" usually means short-squeeze momentum is steadily building. If prices break higher out of the range, short covering overhead could accelerate the move. However, it should be noted that elevated OI combined with a highly divergent structure also means market leverage is high, and if prices weaken, the deleveraging process could similarly amplify volatility.
4.2 Options Trading Volume Expanded in Phases, While Monthly Contracts Still Dominated the Structure
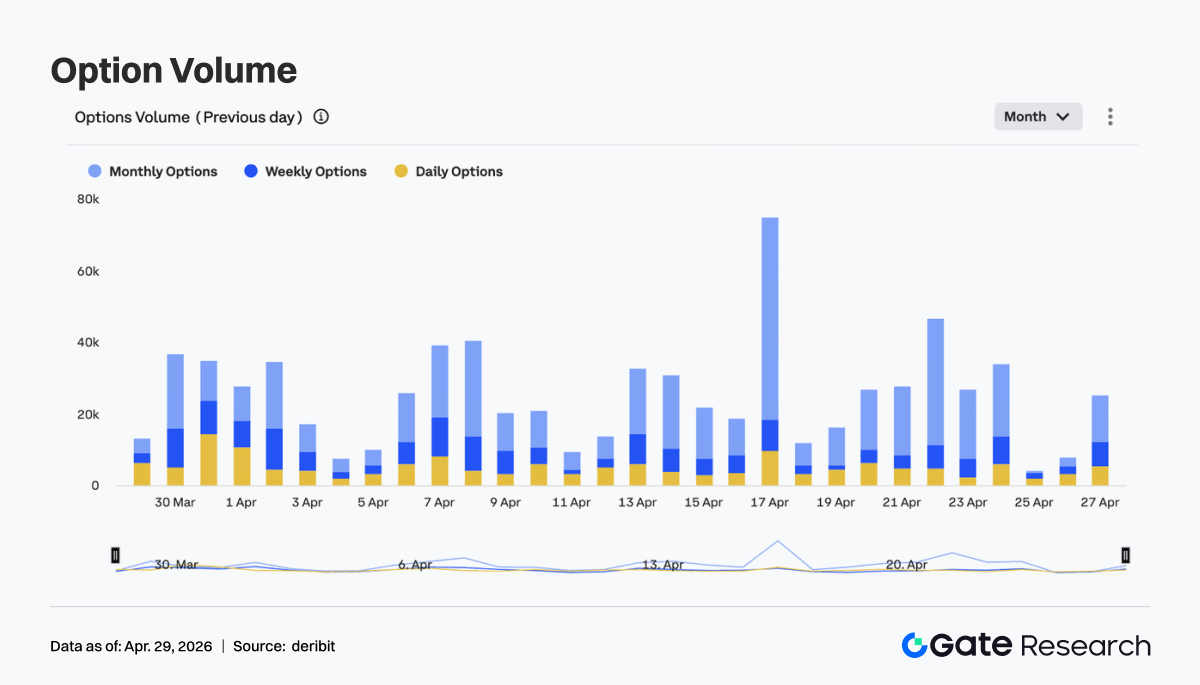
BTC options market trading volume showed characteristics of phased expansion overall, with clear peaks appearing around April 17 and April 23, when single-day trading volume was significantly higher than the weekly average. Structurally, monthly options still dominated, with their share consistently above weekly and daily options, indicating that market participants still mainly favored medium-term structural positioning, while short-duration trading existed more as an event-driven or short-term hedging tool.
In terms of rhythm, the timing of volume spikes roughly corresponded to periods of rapid price movement or around local highs, reflecting that during the price rally, hedging demand and active trading behavior both increased simultaneously. Overall, the options market has not shown any clear sign of shifting toward shorter durations, and the structure remains tilted toward medium-term allocation; however, the pulse-like expansion in volume also means that in key price ranges, demand for volatility trading and risk management has clearly risen, which may intensify short-term price volatility.
4.3 Implied Volatility Across Tenors Rises Overall, While Term Structure Tends to Converge
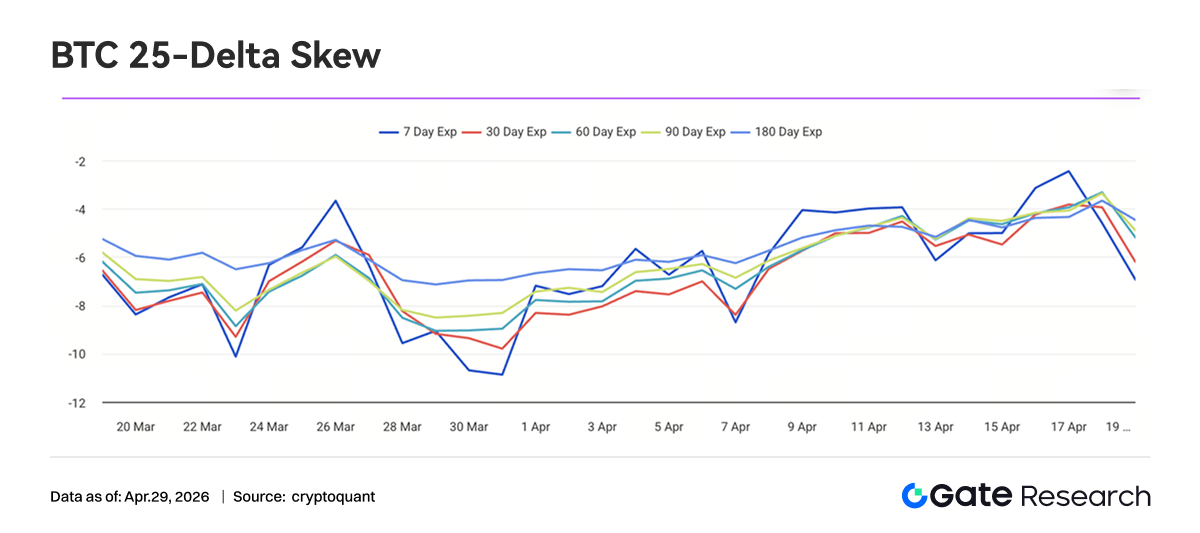
Over the past week, implied volatility across BTC tenors generally showed a choppy upward trend. IV for 7D, 30D, 60D, and longer tenors all gradually rose from the lows at the beginning of the month, with short-dated tenors (7D) fluctuating more noticeably, once falling close to the -10 range before quickly rebounding to around -3, indicating a clear recovery in the market’s short-term pricing of volatility. At the same time, spreads between different tenors gradually narrowed, and the term structure showed a certain degree of "flattening."
In terms of rhythm, after mid-April, IV across all tenors rose in sync, indicating that the market’s expectation of future volatility uncertainty increased, rather than being driven by a single short-term event. Overall, the rebound in implied volatility and the high-level consolidation in prices confirm each other, reflecting intensifying market divergence and rising hedging demand. Against the backdrop of converging term structure, the difference between short- and medium-term risk premiums has narrowed. If a directional breakout occurs later, IV may still have further room to rise.
4.4 BTC Volatility Index Stabilizes After a Choppy Decline, with Short-Term Volatility Compressed
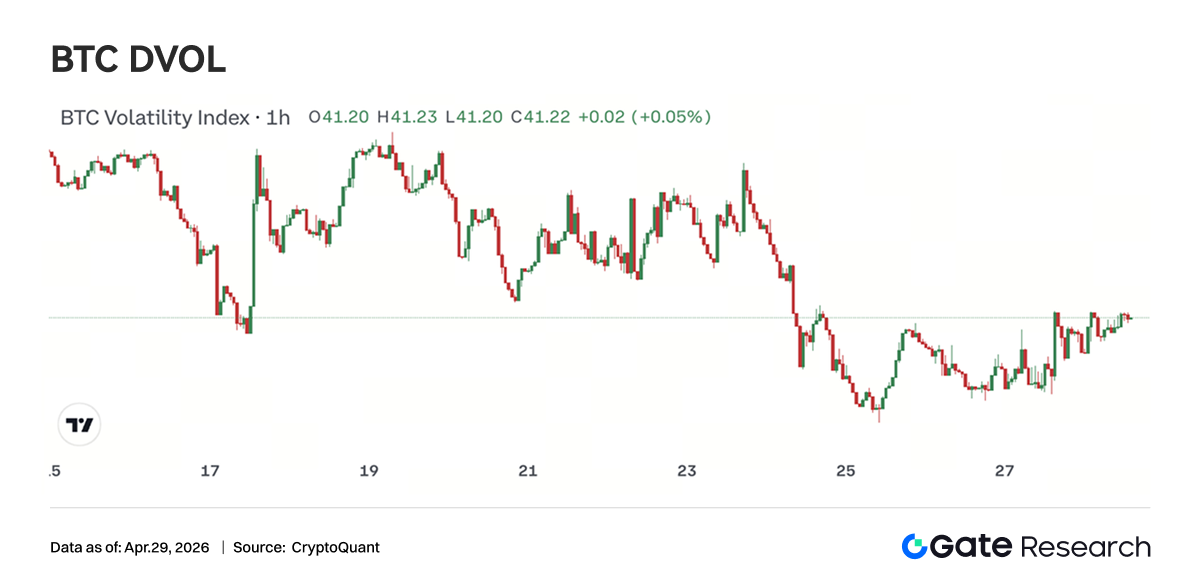
The BTC Volatility Index (BVOL) generally showed a choppy downward trend. After a clear decline in mid-April, it gradually stabilized in the low range and is currently fluctuating narrowly around 41. From the perspective of market structure, volatility did not expand in sync during the price rally; instead, it compressed, showing that the market’s pricing of trend continuation has become more stable and that short-term panic has clearly eased.
In terms of rhythm, volatility dropped rapidly around April 18, corresponding to a phased price pullback followed by a rebound, indicating that after a round of volatility release, the market entered a relatively stable stage. Overall, the market is currently in a combined state of "high-level price consolidation + volatility compression," meaning it is accumulating conditions for the next stage of directional breakout. Once price breaks out of the range, volatility will most likely expand again, driving rapid repricing on the derivatives side.
5. Outlook
6. Gate Institutional Updates
-
Trading structure optimized, outperforming the industry
-
Spot continued to outperform the market, up 20.09% week-over-week; contracts performed steadily better than the industry
-
30+ new business opportunities added in a single week, with the pipeline expanding faster
-
CrossEx trading volume and asset scale continued to hit record highs
-
Multiple leading institutions launched cross-exchange arbitrage, hedging, and cross-venue strategies
-
CrossEx trading volume and asset scale continued to hit record highs, with trading volume up 79% week-over-week and asset scale up 816% week-over-week
-
Gate trading system technology continues to upgrade, with the 3.0 architecture about to go live
-
Deployment preparation for the 3.0 architecture has been completed, and client testing is expected to begin in May
-
SBE + real-time BBO has gone live, significantly improving data and matching efficiency
-
Latency and API capabilities continue to be optimized, strengthening the high-frequency trading experience
-
TradFi and institutional infrastructure continue to improve
-
Banking and compliance channels continue to expand, accelerating institutional capital onboarding
-
TradFi order management and API systems continue to improve
Sources:
-
Investing, https://investing.com/currencies/xau-usd-historical-data
-
Gate, https://www.gate.com/trade/BTC_USDT
-
CMC, https://coinmarketcap.com/real-world-assets/?type=all-tokens
-
Coinglass, https://www.coinglass.com/pro/depth-delta
-
Dune, https://dune.com/gateresearch/gate-tradfi#weekly-volume
-
Dune, https://dune.com/gateresearch/gate-institutional-weekly-report
-
Bybit, https://www.bybit.com/future-activity/en/tradfi
-
Bitget, https://www.bitgettradfi.com/tradfi/XAUUSD
-
CryptoQuant, https://cryptoquant.com/asset/btc/chart/derivatives
-
Amberdata, https://pro.amberdata.io/options/deribit/btc/current/
Gate Research is a comprehensive blockchain and cryptocurrency research platform that provides deep content for readers, including technical analysis, market insights, industry research, trend forecasting, and macroeconomic policy analysis.
Disclaimer
Investing in cryptocurrency markets involves high risk. Users are advised to conduct their own research and fully understand the nature of the assets and products before making any investment decisions. Gate is not responsible for any losses or damages arising from such decisions.