Futures
Accédez à des centaines de contrats perpétuels
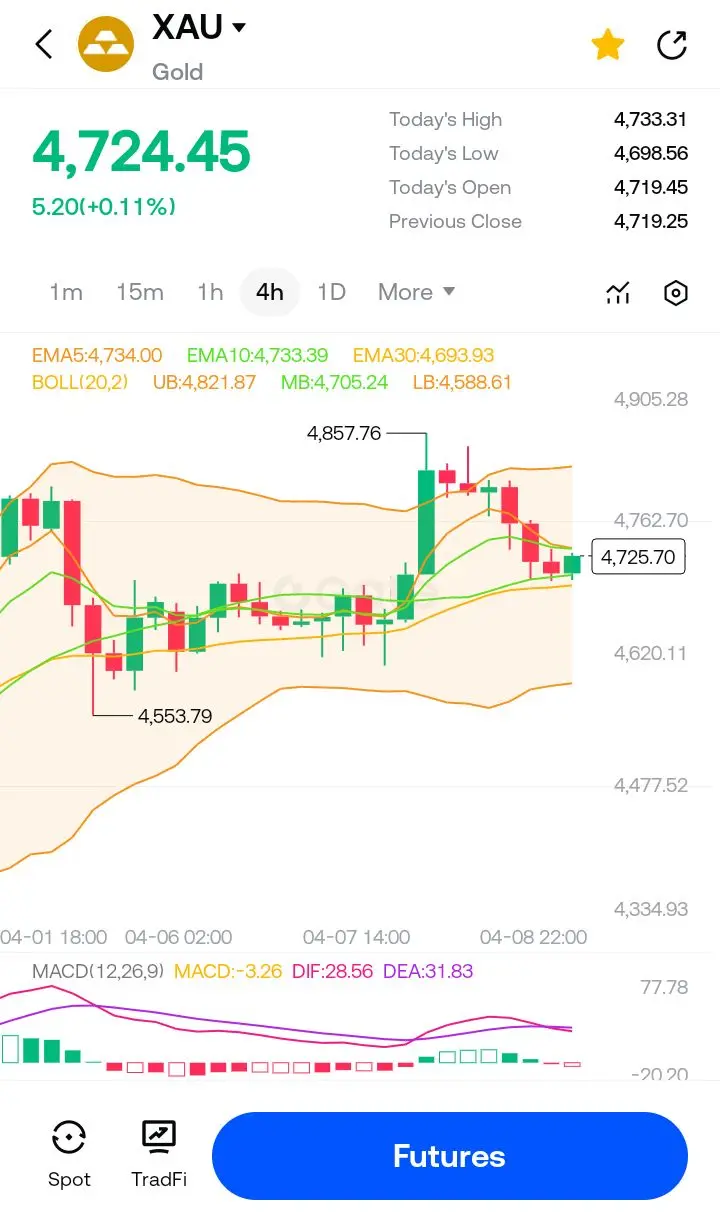
TradFi
Or
Une plateforme pour les actifs mondiaux
Options
Hot
Tradez des options classiques de style européen
Compte unifié
Maximiser l'efficacité de votre capital
Trading démo
Introduction au trading futures
Préparez-vous à trader des contrats futurs
Événements futures
Participez aux événements et gagnez
Demo Trading
Utiliser des fonds virtuels pour faire l'expérience du trading sans risque
Lancer
CandyDrop
Collecte des candies pour obtenir des airdrops
Launchpool
Staking rapide, Gagnez de potentiels nouveaux jetons
HODLer Airdrop
Conservez des GT et recevez d'énormes airdrops gratuitement
Pre-IPOs
Accédez à l'intégralité des introductions en bourse mondiales
Points Alpha
Tradez on-chain et gagnez des airdrops
Points Futures
Gagnez des points Futures et réclamez vos récompenses d’airdrop.
Investissement
Simple Earn
Gagner des intérêts avec des jetons inutilisés
Investissement automatique
Auto-invest régulier
Double investissement
Profitez de la volatilité du marché
Staking souple
Gagnez des récompenses grâce au staking flexible
Prêt Crypto
0 Fees
Mettre en gage un crypto pour en emprunter une autre
Centre de prêts
Centre de prêts intégré
Plus