Crypto markets often shift between strong rallies, sharp declines, and sideways consolidation. In these conditions, traders need tools that do more than show price direction. They also need to understand whether the current move has enough pressure behind it to continue. BBP became useful because it separates bullish pressure from bearish pressure in a simple visual format. Rather than treating every price move as equally meaningful, it asks whether buyers are pushing price meaningfully above its average or whether sellers are forcing price below it.
This makes BBP especially helpful as a confirmation tool. It does not predict the market on its own, but it can support chart reading by showing whether price movement aligns with underlying buyer or seller strength.
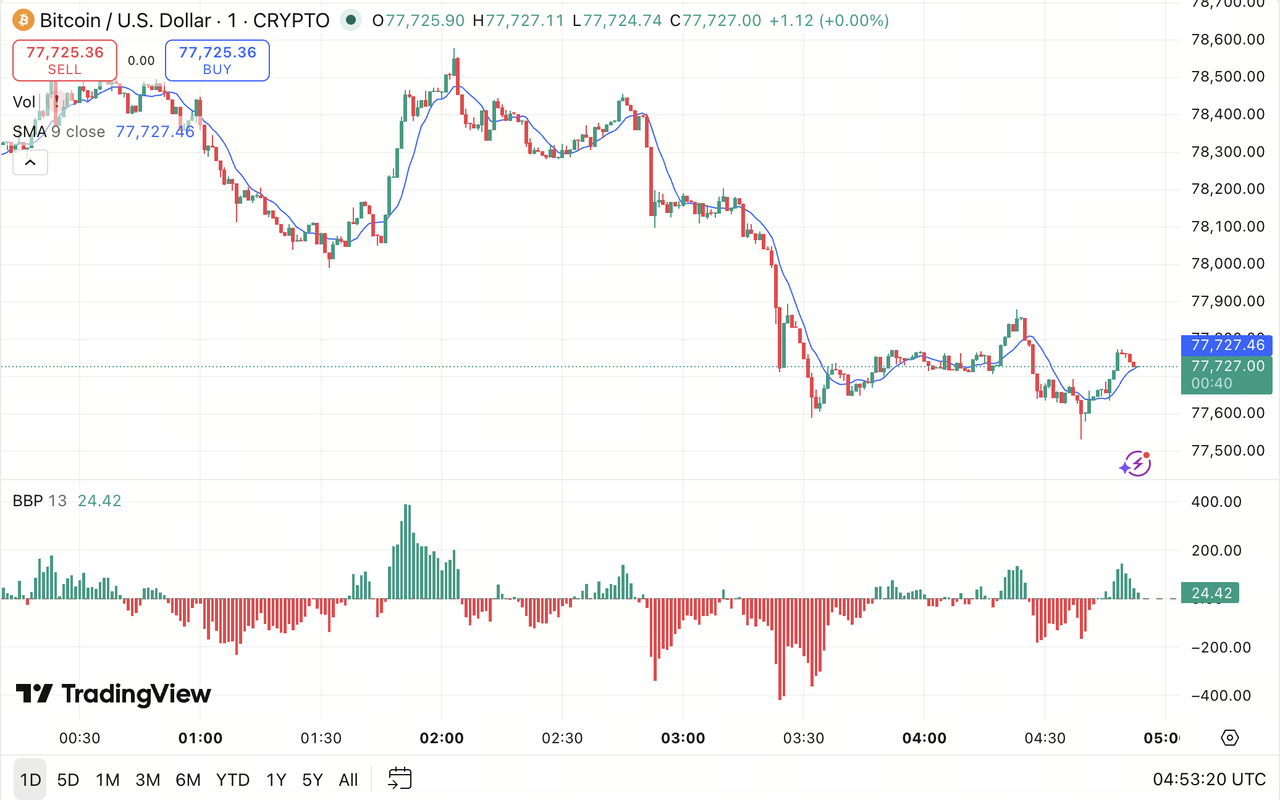
Source: TradingView
What Bull Bear Power (BBP) is
Bull Bear Power (BBP) refers to a technical indicator tool for assessing the relative strength of buyers and sellers by comparing price extremes with an exponential moving average, usually the 13-period EMA.
The concept behind BBP comes from a simple market observation: the highest price in a period reflects the strongest level buyers managed to reach, while the lowest price reflects the strongest level sellers managed to force. By comparing these highs and lows with the EMA, BBP shows whether market pressure leans more toward bullish or bearish control.
A BBP reading above zero usually points to stronger buying pressure, as price is moving above its recent average. A BBP reading below zero usually points to stronger selling pressure, as price is moving below that average.
In crypto trading, BBP often serves as a trend confirmation tool rather than a standalone signal. It helps traders judge whether a price move has support from real buying or selling pressure, especially during volatile market conditions.
What Bull Bear Power Measures
Bull Bear Power measures how strongly buyers or sellers are pushing price away from a short-term average, usually the 13-period exponential moving average.
The indicator is based on a simple idea: in any trading period, the high reflects the strongest point reached by buyers, while the low reflects the strongest point reached by sellers. The EMA acts as a reference level that represents the market’s recent average price.
When price highs move far above the EMA, it suggests buyers have enough strength to push the market beyond its recent average. When price lows fall far below the EMA, it suggests sellers apply pressure and forcing price beneath that reference level.
In practical chart reading, BBP helps answer three questions:
-
Are buyers gaining control?
-
Are sellers gaining control?
-
Is the current trend supported by real pressure or starting to weaken?
For beginners, the most important point is that BBP measures pressure, not certainty. A positive reading does not automatically mean price will rise, and a negative reading does not automatically mean price will fall. The value of BBP comes from reading it together with trend direction, price structure, and other confirmation tools.
How BBP Is Calculated Using EMA
BBP is calculated by comparing the period high and period low with an exponential moving average. The EMA period is usually set to 13, although traders may adjust it depending on the chart timeframe.
The core calculation idea is:
-
Bull Power = High price − EMA
-
Bear Power = Low price − EMA
-
BBP often combines these readings to show overall buyer and seller pressure
The EMA is important because it gives more weight to recent prices. This makes it more responsive than a simple moving average, which treats all prices in the period equally. In fast-moving crypto markets, this responsiveness can help traders see changes in pressure more quickly.
If the high is well above the EMA, Bull Power becomes stronger. If the low is well below the EMA, Bear Power becomes stronger. The distance between price extremes and the EMA creates the signal.
This calculation does not need to be complex to be useful. The basic logic is that strong buyers should be able to push price above its recent average, while strong sellers should be able to push price below it.
Reading Buyer vs Seller Strength
BBP is usually read around a central zero line. Values above zero suggest bullish pressure, while values below zero suggest bearish pressure.
When BBP is positive, buyers are generally stronger than sellers. This often means price highs are being made above the EMA, showing that buyers are able to push the market beyond its recent average. In an uptrend, this can support the idea that demand remains active.
When BBP is negative, sellers are generally stronger than buyers. This means price lows are falling below the EMA, showing that sellers are pushing the market under its recent average. In a downtrend, this can confirm that supply remains dominant.
The size of the reading also matters. A small positive value may show mild bullish pressure, while a large positive value may show stronger buyer control. A small negative value may show weak selling pressure, while a deep negative value may suggest stronger bearish activity.
However, extreme readings should be interpreted carefully. Very high or very low values may show strength, but they can also appear after a move has already stretched far from its average. This is why BBP should be read with price structure rather than treated as a direct entry signal.
| BBP Reading |
Market Interpretation |
Practical Meaning |
| Above zero |
Bullish pressure |
Buyers are pushing price above the EMA |
| Below zero |
Bearish pressure |
Sellers are pushing price below the EMA |
| Rising BBP |
Increasing buyer strength or fading seller pressure |
Trend may be gaining support |
| Falling BBP |
Increasing seller strength or fading buyer pressure |
Trend may be weakening |
| Near zero |
Balanced pressure |
Market may be consolidating or lacking direction |
BBP in Trend Confirmation
BBP is most useful when it confirms what price action is already suggesting. In other words, it works best as a supporting tool, not as the main reason for a trade decision.
In an uptrend, traders may look for BBP to stay mostly positive or recover quickly after brief dips. This suggests that buyers continue to defend the trend and that pullbacks may be temporary rather than signs of a full reversal.
In a downtrend, traders may look for BBP to stay mostly negative or fail to rise strongly above zero. This suggests that sellers remain in control and that upward bounces may lack lasting strength.
BBP can also help identify weakening trends. For example, if price keeps making higher highs but BBP fails to show stronger bullish pressure, the move may be losing force. This kind of divergence does not guarantee a reversal, but it can warn traders to be more cautious.
The same idea applies in bearish markets. If price makes lower lows but BBP becomes less negative, selling pressure may be weakening. This can suggest that sellers are losing control, especially if price begins to form a base or break above resistance.
For crypto traders, this is useful because many price moves are sharp but short-lived. BBP helps separate moves supported by pressure from moves that may be driven by temporary volatility.
BBP vs Momentum Indicators
BBP is related to momentum oscillators, but it is not the same as common momentum indicators. Momentum indicators usually focus on the speed or rate of price change. BBP focuses more specifically on the relationship between price extremes and an EMA.
For example, the Awesome Oscillator (AO) compares short-term and longer-term market momentum using moving averages based on median price. It helps traders see whether momentum is shifting toward buyers or sellers. BBP, by contrast, looks at how far highs and lows move away from an EMA, which gives a more direct view of buyer and seller pressure.
The distinction matters because two indicators can respond differently to the same market. AO may show broader momentum changes, while BBP may highlight whether buyers or sellers are currently forcing price beyond the average range.
A trader might use BBP and a momentum indicator together. BBP can show whether buyer or seller pressure is present, while an indicator such as the Awesome Oscillator (AO) can help confirm whether broader momentum supports the same direction.
This does not mean one indicator is better than the other. They answer different questions. BBP asks, “Who is applying pressure relative to the EMA?” Momentum indicators ask, “How is the speed or direction of price movement changing?”
For beginners, this difference is important. Using several indicators that all measure the same thing can create confusion. Combining BBP with a trend tool or a different type of momentum indicator can provide a more balanced view.
Limitations of BBP
BBP has several limitations, especially when used without market context.
First, BBP can give noisy readings in sideways markets. When price moves around the EMA without a clear trend, the indicator may shift above and below zero frequently. These changes can look meaningful but may only reflect short-term fluctuation.
Second, BBP is based on past price data. Like most technical indicators, it does not know what will happen next. It reflects current and recent market pressure, but it cannot predict news events, liquidity shocks, or sudden changes in sentiment.
Third, BBP can be misleading during extreme volatility. Crypto assets may move sharply above or below the EMA in a short time, creating strong readings that later fade quickly. A large BBP value may show pressure, but it can also appear near the end of an overextended move.
Fourth, BBP should not be used as a standalone buy or sell signal. A positive reading is not automatically a reason to enter a long position, and a negative reading is not automatically a reason to enter a short position. The indicator becomes more useful when combined with trend direction, support and resistance, volume, or broader momentum confirmation.
Finally, parameter choice matters. The common 13-period EMA may work well in some markets and timeframes, but it may be too sensitive or too slow in others. Shorter settings may react faster but create more false signals. Longer settings may reduce noise but respond more slowly.
Conclusion
Bull Bear Power is a practical indicator for understanding buyer and seller strength in relation to an exponential moving average. It helps traders see whether price highs and lows are moving meaningfully above or below a recent average, which can reveal whether bullish or bearish pressure is active.
Its main value is confirmation. In an uptrend, positive BBP can support the view that buyers remain strong. In a downtrend, negative BBP can confirm that sellers are still applying pressure. When BBP weakens while price continues in the same direction, it may warn that the trend is losing force.
BBP should be understood as one part of chart analysis. It is most useful when combined with trend structure, support and resistance, volume, or momentum tools such as the Awesome Oscillator (AO). Used this way, it can help traders read market pressure more clearly without treating any single indicator as a complete trading system.
FAQs
What is Bull Bear Power in simple terms?
Bull Bear Power is an indicator that shows whether buyers or sellers are stronger by comparing price highs and lows with an exponential moving average.
What EMA is commonly used for BBP?
BBP commonly uses a 13-period exponential moving average. This EMA acts as the reference level for measuring bullish and bearish pressure.
What does a positive BBP reading mean?
A positive BBP reading usually means buyers are pushing price above the EMA. This suggests bullish pressure, especially when price is already in an uptrend.
What does a negative BBP reading mean?
A negative BBP reading usually means sellers are pushing price below the EMA. This suggests bearish pressure, especially when price is already in a downtrend.
Can BBP predict market reversals?
BBP cannot predict reversals with certainty. It may show weakening pressure or divergence before a trend changes, but it should be confirmed with price action and other tools.
Is BBP useful for crypto trading?
BBP can be useful in crypto trading because it helps show whether buyers or sellers are dominating during volatile moves. It is best used with trend context rather than as a standalone signal.
Should beginners use BBP alone?
Beginners should not use BBP alone. It is more reliable when paired with trend analysis, support and resistance, volume, or another confirmation indicator.